Immigrants from Ghana vs Danish 9th Grade
COMPARE
Immigrants from Ghana
Danish
9th Grade
9th Grade Comparison
Immigrants from Ghana
Danes
93.8%
9TH GRADE
0.2/ 100
METRIC RATING
271st/ 347
METRIC RANK
96.5%
9TH GRADE
100.0/ 100
METRIC RATING
13th/ 347
METRIC RANK
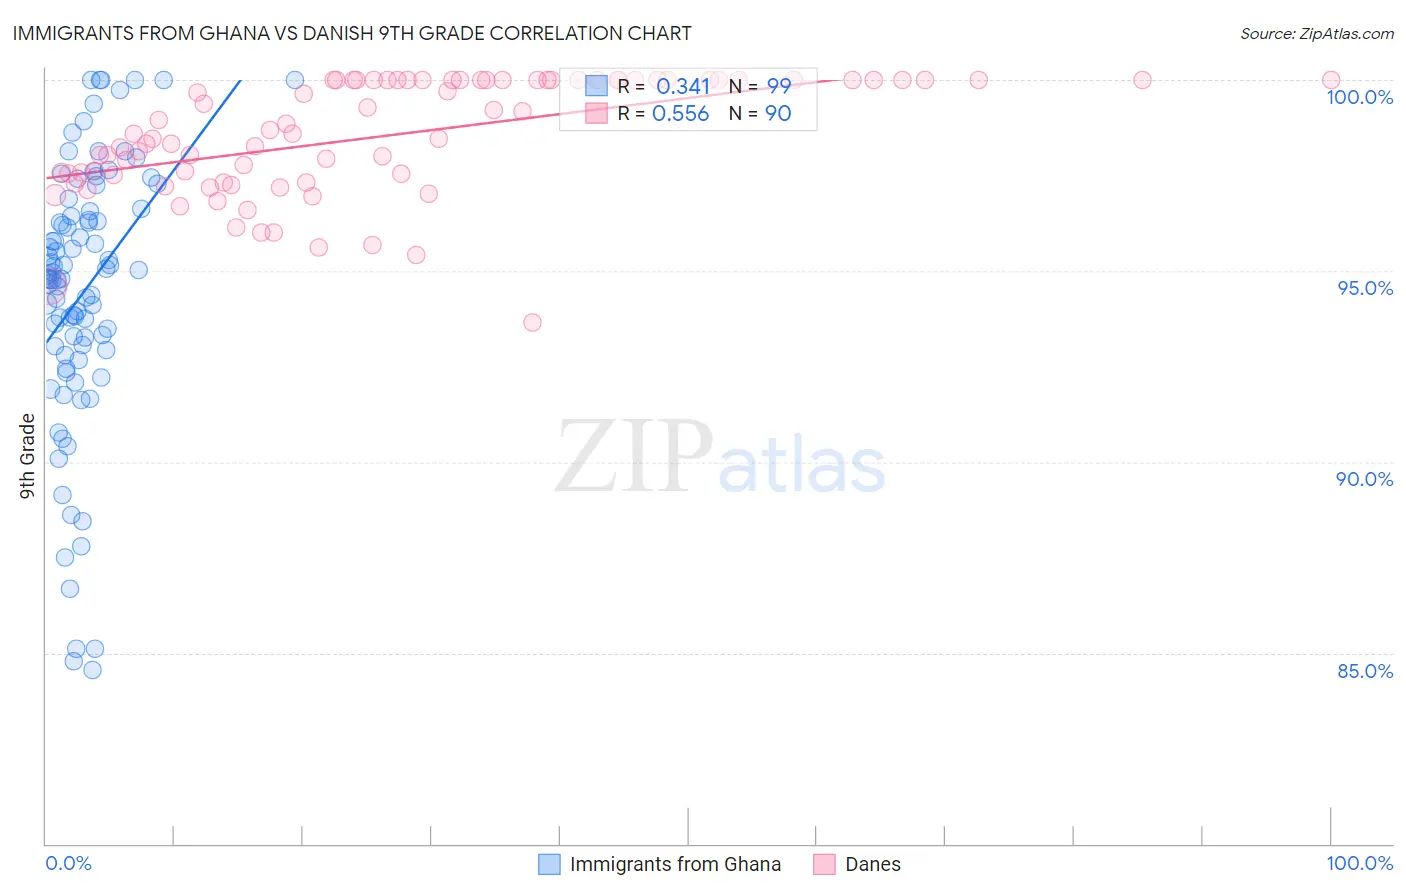
Immigrants from Ghana vs Danish 9th Grade Correlation Chart
The statistical analysis conducted on geographies consisting of 199,952,023 people shows a mild positive correlation between the proportion of Immigrants from Ghana and percentage of population with at least 9th grade education in the United States with a correlation coefficient (R) of 0.341 and weighted average of 93.8%. Similarly, the statistical analysis conducted on geographies consisting of 474,193,553 people shows a substantial positive correlation between the proportion of Danes and percentage of population with at least 9th grade education in the United States with a correlation coefficient (R) of 0.556 and weighted average of 96.5%, a difference of 2.9%.
9th Grade Correlation Summary
| Measurement | Immigrants from Ghana | Danish |
| Minimum | 84.5% | 93.7% |
| Maximum | 100.0% | 100.0% |
| Range | 15.5% | 6.3% |
| Mean | 94.4% | 98.5% |
| Median | 94.8% | 98.7% |
| Interquartile 25% (IQ1) | 92.9% | 97.5% |
| Interquartile 75% (IQ3) | 96.6% | 100.0% |
| Interquartile Range (IQR) | 3.6% | 2.5% |
| Standard Deviation (Sample) | 3.5% | 1.5% |
| Standard Deviation (Population) | 3.5% | 1.5% |
Similar Demographics by 9th Grade
Demographics Similar to Immigrants from Ghana by 9th Grade
In terms of 9th grade, the demographic groups most similar to Immigrants from Ghana are Immigrants from Western Africa (93.8%, a difference of 0.010%), Yuman (93.8%, a difference of 0.020%), Immigrants from South America (93.8%, a difference of 0.020%), Peruvian (93.8%, a difference of 0.020%), and Immigrants from Uruguay (93.8%, a difference of 0.030%).
| Demographics | Rating | Rank | 9th Grade |
| Immigrants | Congo | 0.4 /100 | #264 | Tragic 93.9% |
| Natives/Alaskans | 0.4 /100 | #265 | Tragic 93.9% |
| Navajo | 0.3 /100 | #266 | Tragic 93.9% |
| Armenians | 0.3 /100 | #267 | Tragic 93.9% |
| Immigrants | Bolivia | 0.3 /100 | #268 | Tragic 93.9% |
| Immigrants | Uruguay | 0.2 /100 | #269 | Tragic 93.8% |
| Yuman | 0.2 /100 | #270 | Tragic 93.8% |
| Immigrants | Ghana | 0.2 /100 | #271 | Tragic 93.8% |
| Immigrants | Western Africa | 0.2 /100 | #272 | Tragic 93.8% |
| Immigrants | South America | 0.2 /100 | #273 | Tragic 93.8% |
| Peruvians | 0.2 /100 | #274 | Tragic 93.8% |
| Immigrants | Colombia | 0.2 /100 | #275 | Tragic 93.8% |
| West Indians | 0.2 /100 | #276 | Tragic 93.7% |
| Immigrants | Philippines | 0.1 /100 | #277 | Tragic 93.7% |
| Immigrants | Eritrea | 0.1 /100 | #278 | Tragic 93.7% |
Demographics Similar to Danes by 9th Grade
In terms of 9th grade, the demographic groups most similar to Danes are Scottish (96.5%, a difference of 0.010%), Irish (96.5%, a difference of 0.010%), Croatian (96.5%, a difference of 0.010%), English (96.6%, a difference of 0.040%), and Lithuanian (96.6%, a difference of 0.070%).
| Demographics | Rating | Rank | 9th Grade |
| Poles | 100.0 /100 | #6 | Exceptional 96.7% |
| Carpatho Rusyns | 100.0 /100 | #7 | Exceptional 96.7% |
| Germans | 100.0 /100 | #8 | Exceptional 96.7% |
| Tlingit-Haida | 100.0 /100 | #9 | Exceptional 96.6% |
| Lithuanians | 100.0 /100 | #10 | Exceptional 96.6% |
| Finns | 100.0 /100 | #11 | Exceptional 96.6% |
| English | 100.0 /100 | #12 | Exceptional 96.6% |
| Danes | 100.0 /100 | #13 | Exceptional 96.5% |
| Scottish | 100.0 /100 | #14 | Exceptional 96.5% |
| Irish | 100.0 /100 | #15 | Exceptional 96.5% |
| Croatians | 100.0 /100 | #16 | Exceptional 96.5% |
| Dutch | 100.0 /100 | #17 | Exceptional 96.5% |
| Scandinavians | 100.0 /100 | #18 | Exceptional 96.5% |
| Welsh | 100.0 /100 | #19 | Exceptional 96.4% |
| Italians | 100.0 /100 | #20 | Exceptional 96.4% |