Immigrants from Ghana vs Cree 2nd Grade
COMPARE
Immigrants from Ghana
Cree
2nd Grade
2nd Grade Comparison
Immigrants from Ghana
Cree
97.3%
2ND GRADE
0.1/ 100
METRIC RATING
279th/ 347
METRIC RANK
98.2%
2ND GRADE
98.0/ 100
METRIC RATING
102nd/ 347
METRIC RANK
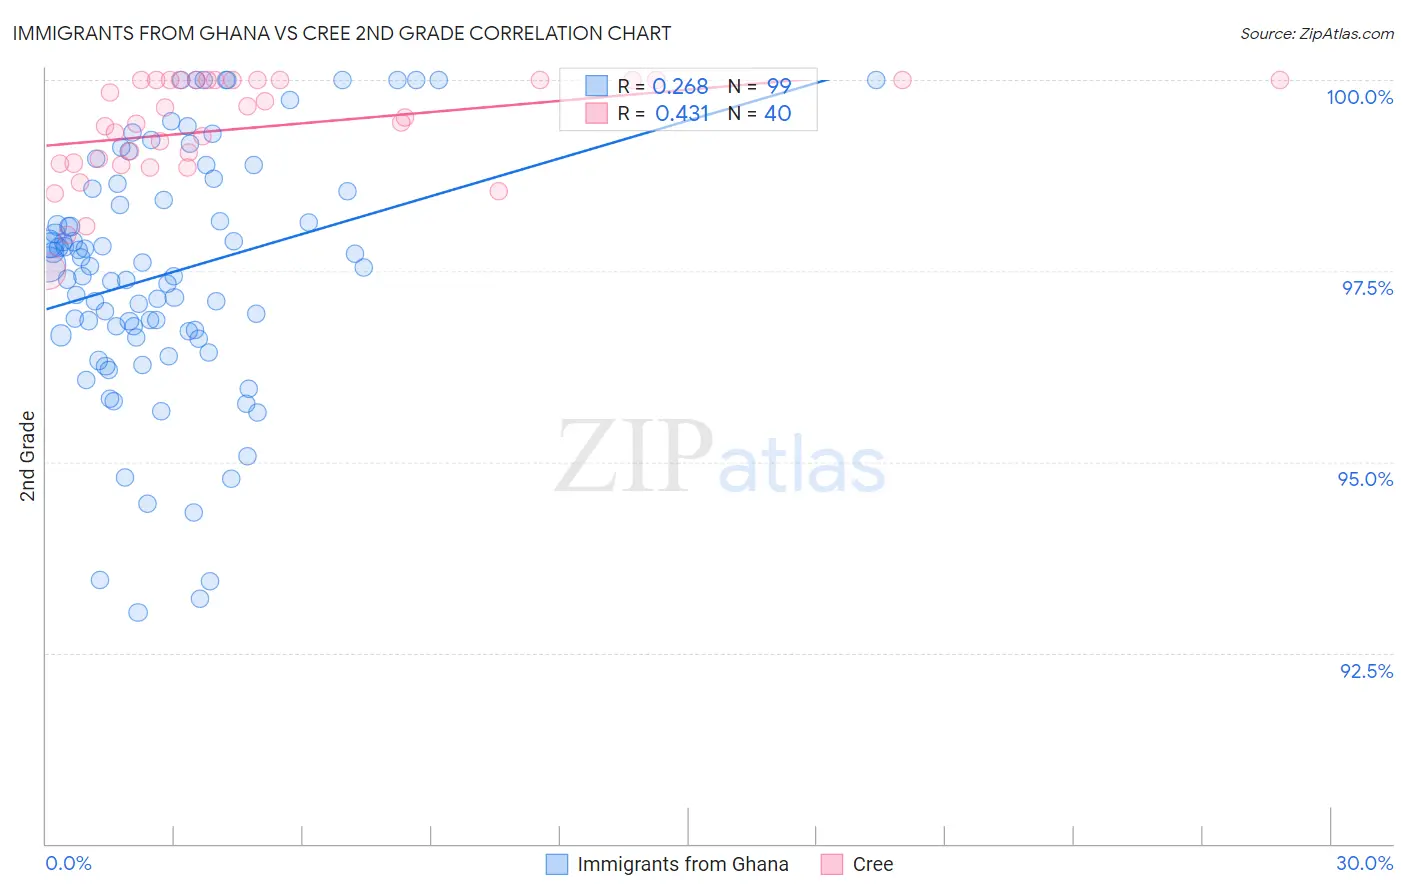
Immigrants from Ghana vs Cree 2nd Grade Correlation Chart
The statistical analysis conducted on geographies consisting of 199,952,023 people shows a weak positive correlation between the proportion of Immigrants from Ghana and percentage of population with at least 2nd grade education in the United States with a correlation coefficient (R) of 0.268 and weighted average of 97.3%. Similarly, the statistical analysis conducted on geographies consisting of 76,204,399 people shows a moderate positive correlation between the proportion of Cree and percentage of population with at least 2nd grade education in the United States with a correlation coefficient (R) of 0.431 and weighted average of 98.2%, a difference of 0.90%.
2nd Grade Correlation Summary
| Measurement | Immigrants from Ghana | Cree |
| Minimum | 93.0% | 97.5% |
| Maximum | 100.0% | 100.0% |
| Range | 7.0% | 2.5% |
| Mean | 97.5% | 99.4% |
| Median | 97.6% | 99.5% |
| Interquartile 25% (IQ1) | 96.7% | 98.9% |
| Interquartile 75% (IQ3) | 98.6% | 100.0% |
| Interquartile Range (IQR) | 1.9% | 1.1% |
| Standard Deviation (Sample) | 1.6% | 0.66% |
| Standard Deviation (Population) | 1.6% | 0.65% |
Similar Demographics by 2nd Grade
Demographics Similar to Immigrants from Ghana by 2nd Grade
In terms of 2nd grade, the demographic groups most similar to Immigrants from Ghana are Afghan (97.3%, a difference of 0.0%), Immigrants from Uzbekistan (97.3%, a difference of 0.010%), Trinidadian and Tobagonian (97.3%, a difference of 0.010%), Barbadian (97.3%, a difference of 0.010%), and Immigrants from Philippines (97.3%, a difference of 0.020%).
| Demographics | Rating | Rank | 2nd Grade |
| Immigrants | Peru | 0.1 /100 | #272 | Tragic 97.4% |
| Immigrants | Bolivia | 0.1 /100 | #273 | Tragic 97.4% |
| Ghanaians | 0.1 /100 | #274 | Tragic 97.4% |
| Immigrants | China | 0.1 /100 | #275 | Tragic 97.3% |
| Immigrants | Philippines | 0.1 /100 | #276 | Tragic 97.3% |
| Immigrants | Western Africa | 0.1 /100 | #277 | Tragic 97.3% |
| Immigrants | Uzbekistan | 0.1 /100 | #278 | Tragic 97.3% |
| Immigrants | Ghana | 0.1 /100 | #279 | Tragic 97.3% |
| Afghans | 0.1 /100 | #280 | Tragic 97.3% |
| Trinidadians and Tobagonians | 0.1 /100 | #281 | Tragic 97.3% |
| Barbadians | 0.1 /100 | #282 | Tragic 97.3% |
| Immigrants | Trinidad and Tobago | 0.0 /100 | #283 | Tragic 97.2% |
| Immigrants | West Indies | 0.0 /100 | #284 | Tragic 97.2% |
| Immigrants | Hong Kong | 0.0 /100 | #285 | Tragic 97.2% |
| Immigrants | Barbados | 0.0 /100 | #286 | Tragic 97.2% |
Demographics Similar to Cree by 2nd Grade
In terms of 2nd grade, the demographic groups most similar to Cree are Immigrants from Ireland (98.2%, a difference of 0.0%), Romanian (98.2%, a difference of 0.0%), Puget Sound Salish (98.2%, a difference of 0.0%), Choctaw (98.2%, a difference of 0.010%), and Nonimmigrants (98.2%, a difference of 0.010%).
| Demographics | Rating | Rank | 2nd Grade |
| South Africans | 98.6 /100 | #95 | Exceptional 98.2% |
| Cypriots | 98.4 /100 | #96 | Exceptional 98.2% |
| Choctaw | 98.3 /100 | #97 | Exceptional 98.2% |
| Immigrants | Nonimmigrants | 98.3 /100 | #98 | Exceptional 98.2% |
| Immigrants | Ireland | 98.0 /100 | #99 | Exceptional 98.2% |
| Romanians | 98.0 /100 | #100 | Exceptional 98.2% |
| Puget Sound Salish | 98.0 /100 | #101 | Exceptional 98.2% |
| Cree | 98.0 /100 | #102 | Exceptional 98.2% |
| Pima | 97.6 /100 | #103 | Exceptional 98.2% |
| Turks | 97.6 /100 | #104 | Exceptional 98.2% |
| Yugoslavians | 97.5 /100 | #105 | Exceptional 98.2% |
| Bhutanese | 97.5 /100 | #106 | Exceptional 98.1% |
| German Russians | 97.4 /100 | #107 | Exceptional 98.1% |
| Immigrants | Switzerland | 97.3 /100 | #108 | Exceptional 98.1% |
| Basques | 97.2 /100 | #109 | Exceptional 98.1% |