Immigrants from Germany vs Native/Alaskan Associate's Degree
COMPARE
Immigrants from Germany
Native/Alaskan
Associate's Degree
Associate's Degree Comparison
Immigrants from Germany
Natives/Alaskans
47.1%
ASSOCIATE'S DEGREE
69.7/ 100
METRIC RATING
158th/ 347
METRIC RANK
34.9%
ASSOCIATE'S DEGREE
0.0/ 100
METRIC RATING
334th/ 347
METRIC RANK
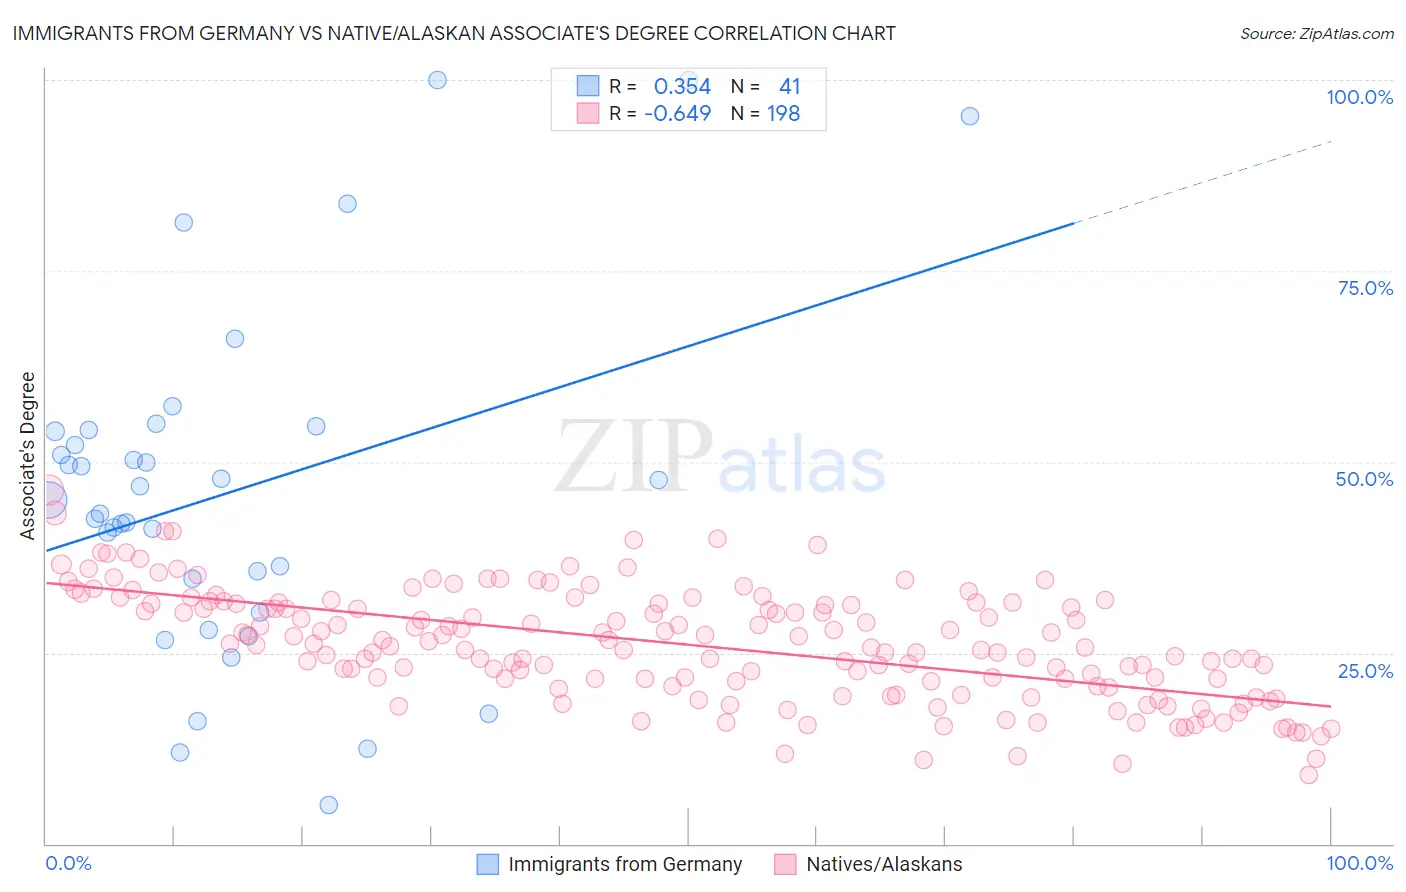
Immigrants from Germany vs Native/Alaskan Associate's Degree Correlation Chart
The statistical analysis conducted on geographies consisting of 463,874,369 people shows a mild positive correlation between the proportion of Immigrants from Germany and percentage of population with at least associate's degree education in the United States with a correlation coefficient (R) of 0.354 and weighted average of 47.1%. Similarly, the statistical analysis conducted on geographies consisting of 513,021,509 people shows a significant negative correlation between the proportion of Natives/Alaskans and percentage of population with at least associate's degree education in the United States with a correlation coefficient (R) of -0.649 and weighted average of 34.9%, a difference of 34.9%.
Associate's Degree Correlation Summary
| Measurement | Immigrants from Germany | Native/Alaskan |
| Minimum | 5.1% | 9.1% |
| Maximum | 100.0% | 46.4% |
| Range | 94.9% | 37.3% |
| Mean | 46.1% | 26.1% |
| Median | 44.9% | 26.1% |
| Interquartile 25% (IQ1) | 32.5% | 21.3% |
| Interquartile 75% (IQ3) | 54.1% | 31.5% |
| Interquartile Range (IQR) | 21.6% | 10.2% |
| Standard Deviation (Sample) | 22.2% | 7.2% |
| Standard Deviation (Population) | 22.0% | 7.2% |
Similar Demographics by Associate's Degree
Demographics Similar to Immigrants from Germany by Associate's Degree
In terms of associate's degree, the demographic groups most similar to Immigrants from Germany are Sudanese (47.1%, a difference of 0.040%), Immigrants from Poland (47.1%, a difference of 0.050%), South American (47.1%, a difference of 0.070%), Kenyan (47.1%, a difference of 0.080%), and Immigrants from Kenya (47.2%, a difference of 0.21%).
| Demographics | Rating | Rank | Associate's Degree |
| Immigrants | North Macedonia | 76.0 /100 | #151 | Good 47.4% |
| Immigrants | Afghanistan | 74.3 /100 | #152 | Good 47.3% |
| Czechs | 72.2 /100 | #153 | Good 47.2% |
| Immigrants | Kenya | 72.1 /100 | #154 | Good 47.2% |
| Kenyans | 70.6 /100 | #155 | Good 47.1% |
| South Americans | 70.5 /100 | #156 | Good 47.1% |
| Sudanese | 70.3 /100 | #157 | Good 47.1% |
| Immigrants | Germany | 69.7 /100 | #158 | Good 47.1% |
| Immigrants | Poland | 69.2 /100 | #159 | Good 47.1% |
| Scottish | 65.4 /100 | #160 | Good 46.9% |
| Scandinavians | 65.2 /100 | #161 | Good 46.9% |
| Immigrants | Africa | 63.2 /100 | #162 | Good 46.8% |
| Somalis | 62.5 /100 | #163 | Good 46.8% |
| Colombians | 62.4 /100 | #164 | Good 46.8% |
| Immigrants | South America | 59.9 /100 | #165 | Average 46.7% |
Demographics Similar to Natives/Alaskans by Associate's Degree
In terms of associate's degree, the demographic groups most similar to Natives/Alaskans are Spanish American Indian (34.9%, a difference of 0.14%), Mexican (35.0%, a difference of 0.24%), Immigrants from Central America (35.0%, a difference of 0.31%), Hopi (34.6%, a difference of 1.0%), and Immigrants from the Azores (35.6%, a difference of 2.1%).
| Demographics | Rating | Rank | Associate's Degree |
| Dutch West Indians | 0.0 /100 | #327 | Tragic 36.5% |
| Alaskan Athabascans | 0.0 /100 | #328 | Tragic 36.5% |
| Paiute | 0.0 /100 | #329 | Tragic 36.4% |
| Apache | 0.0 /100 | #330 | Tragic 36.2% |
| Immigrants | Azores | 0.0 /100 | #331 | Tragic 35.6% |
| Immigrants | Central America | 0.0 /100 | #332 | Tragic 35.0% |
| Mexicans | 0.0 /100 | #333 | Tragic 35.0% |
| Natives/Alaskans | 0.0 /100 | #334 | Tragic 34.9% |
| Spanish American Indians | 0.0 /100 | #335 | Tragic 34.9% |
| Hopi | 0.0 /100 | #336 | Tragic 34.6% |
| Lumbee | 0.0 /100 | #337 | Tragic 34.1% |
| Pueblo | 0.0 /100 | #338 | Tragic 34.0% |
| Immigrants | Mexico | 0.0 /100 | #339 | Tragic 33.7% |
| Navajo | 0.0 /100 | #340 | Tragic 32.6% |
| Inupiat | 0.0 /100 | #341 | Tragic 32.6% |