Immigrants from Germany vs Immigrants from India 5th Grade
COMPARE
Immigrants from Germany
Immigrants from India
5th Grade
5th Grade Comparison
Immigrants from Germany
Immigrants from India
97.8%
5TH GRADE
98.5/ 100
METRIC RATING
96th/ 347
METRIC RANK
97.8%
5TH GRADE
99.2/ 100
METRIC RATING
80th/ 347
METRIC RANK
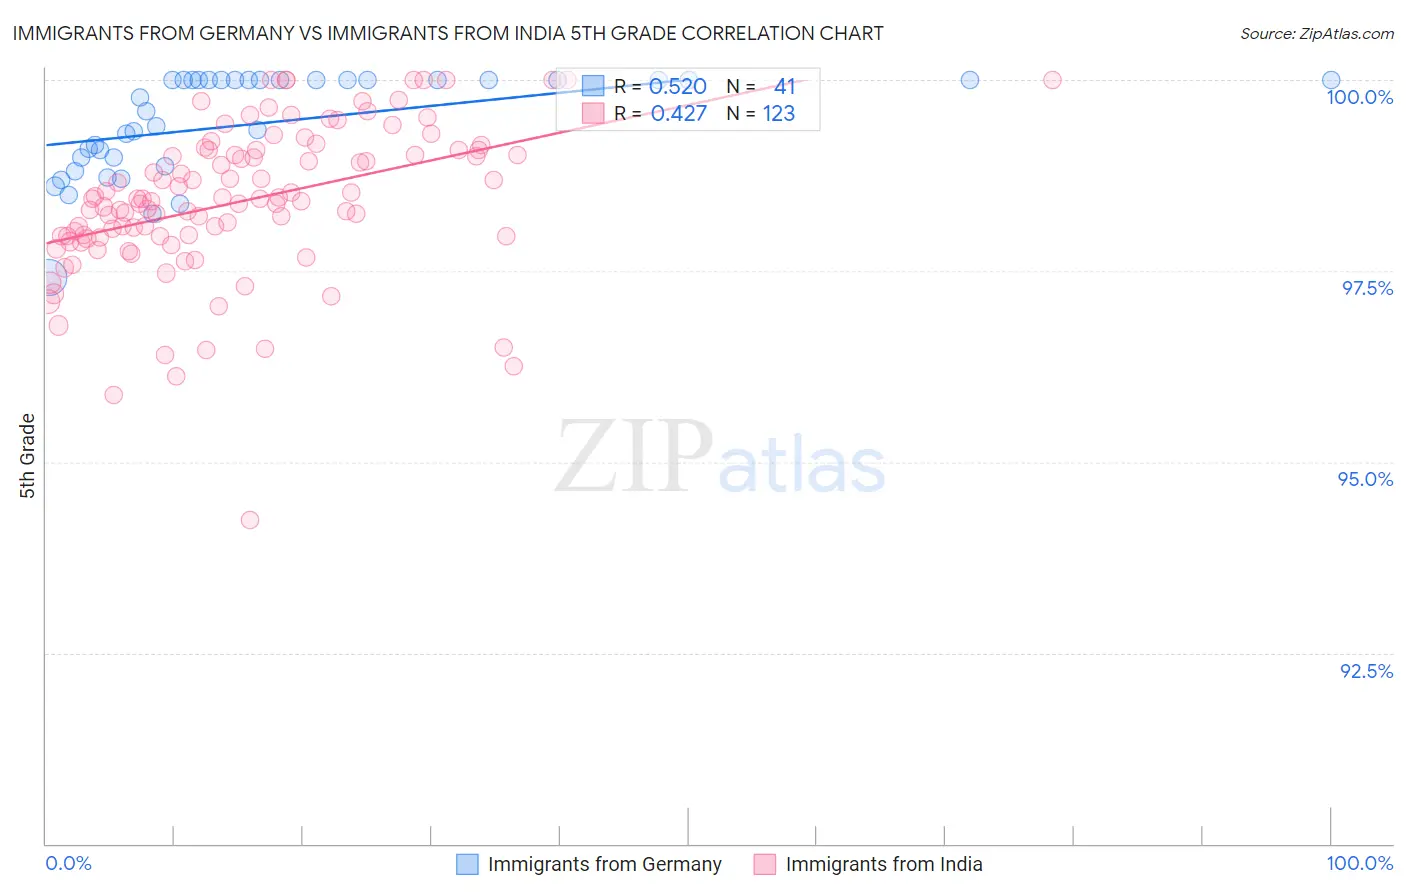
Immigrants from Germany vs Immigrants from India 5th Grade Correlation Chart
The statistical analysis conducted on geographies consisting of 463,886,643 people shows a substantial positive correlation between the proportion of Immigrants from Germany and percentage of population with at least 5th grade education in the United States with a correlation coefficient (R) of 0.520 and weighted average of 97.8%. Similarly, the statistical analysis conducted on geographies consisting of 434,105,844 people shows a moderate positive correlation between the proportion of Immigrants from India and percentage of population with at least 5th grade education in the United States with a correlation coefficient (R) of 0.427 and weighted average of 97.8%, a difference of 0.060%.
5th Grade Correlation Summary
| Measurement | Immigrants from Germany | Immigrants from India |
| Minimum | 97.4% | 94.2% |
| Maximum | 100.0% | 100.0% |
| Range | 2.6% | 5.8% |
| Mean | 99.4% | 98.4% |
| Median | 99.8% | 98.4% |
| Interquartile 25% (IQ1) | 98.9% | 97.9% |
| Interquartile 75% (IQ3) | 100.0% | 99.1% |
| Interquartile Range (IQR) | 1.1% | 1.1% |
| Standard Deviation (Sample) | 0.67% | 0.99% |
| Standard Deviation (Population) | 0.66% | 0.99% |
Demographics Similar to Immigrants from Germany and Immigrants from India by 5th Grade
In terms of 5th grade, the demographic groups most similar to Immigrants from Germany are Immigrants from Denmark (97.8%, a difference of 0.0%), Romanian (97.8%, a difference of 0.0%), Immigrants from Sweden (97.8%, a difference of 0.010%), Delaware (97.8%, a difference of 0.010%), and Cree (97.7%, a difference of 0.010%). Similarly, the demographic groups most similar to Immigrants from India are Immigrants from Lithuania (97.8%, a difference of 0.0%), Icelander (97.8%, a difference of 0.0%), Pueblo (97.8%, a difference of 0.0%), Osage (97.8%, a difference of 0.010%), and Zimbabwean (97.8%, a difference of 0.020%).
| Demographics | Rating | Rank | 5th Grade |
| Osage | 99.3 /100 | #78 | Exceptional 97.8% |
| Immigrants | Lithuania | 99.2 /100 | #79 | Exceptional 97.8% |
| Immigrants | India | 99.2 /100 | #80 | Exceptional 97.8% |
| Icelanders | 99.2 /100 | #81 | Exceptional 97.8% |
| Pueblo | 99.2 /100 | #82 | Exceptional 97.8% |
| Zimbabweans | 99.0 /100 | #83 | Exceptional 97.8% |
| Potawatomi | 99.0 /100 | #84 | Exceptional 97.8% |
| Immigrants | Belgium | 99.0 /100 | #85 | Exceptional 97.8% |
| Cypriots | 98.9 /100 | #86 | Exceptional 97.8% |
| Immigrants | Australia | 98.8 /100 | #87 | Exceptional 97.8% |
| Shoshone | 98.8 /100 | #88 | Exceptional 97.8% |
| Immigrants | South Africa | 98.8 /100 | #89 | Exceptional 97.8% |
| Immigrants | Ireland | 98.8 /100 | #90 | Exceptional 97.8% |
| Immigrants | Western Europe | 98.8 /100 | #91 | Exceptional 97.8% |
| Immigrants | Sweden | 98.7 /100 | #92 | Exceptional 97.8% |
| Delaware | 98.6 /100 | #93 | Exceptional 97.8% |
| Immigrants | Denmark | 98.6 /100 | #94 | Exceptional 97.8% |
| Romanians | 98.6 /100 | #95 | Exceptional 97.8% |
| Immigrants | Germany | 98.5 /100 | #96 | Exceptional 97.8% |
| Cree | 98.4 /100 | #97 | Exceptional 97.7% |
| Yugoslavians | 98.3 /100 | #98 | Exceptional 97.7% |