Immigrants from France vs Immigrants from Sweden Bachelor's Degree
COMPARE
Immigrants from France
Immigrants from Sweden
Bachelor's Degree
Bachelor's Degree Comparison
Immigrants from France
Immigrants from Sweden
46.4%
BACHELOR'S DEGREE
100.0/ 100
METRIC RATING
27th/ 347
METRIC RANK
47.0%
BACHELOR'S DEGREE
100.0/ 100
METRIC RATING
23rd/ 347
METRIC RANK
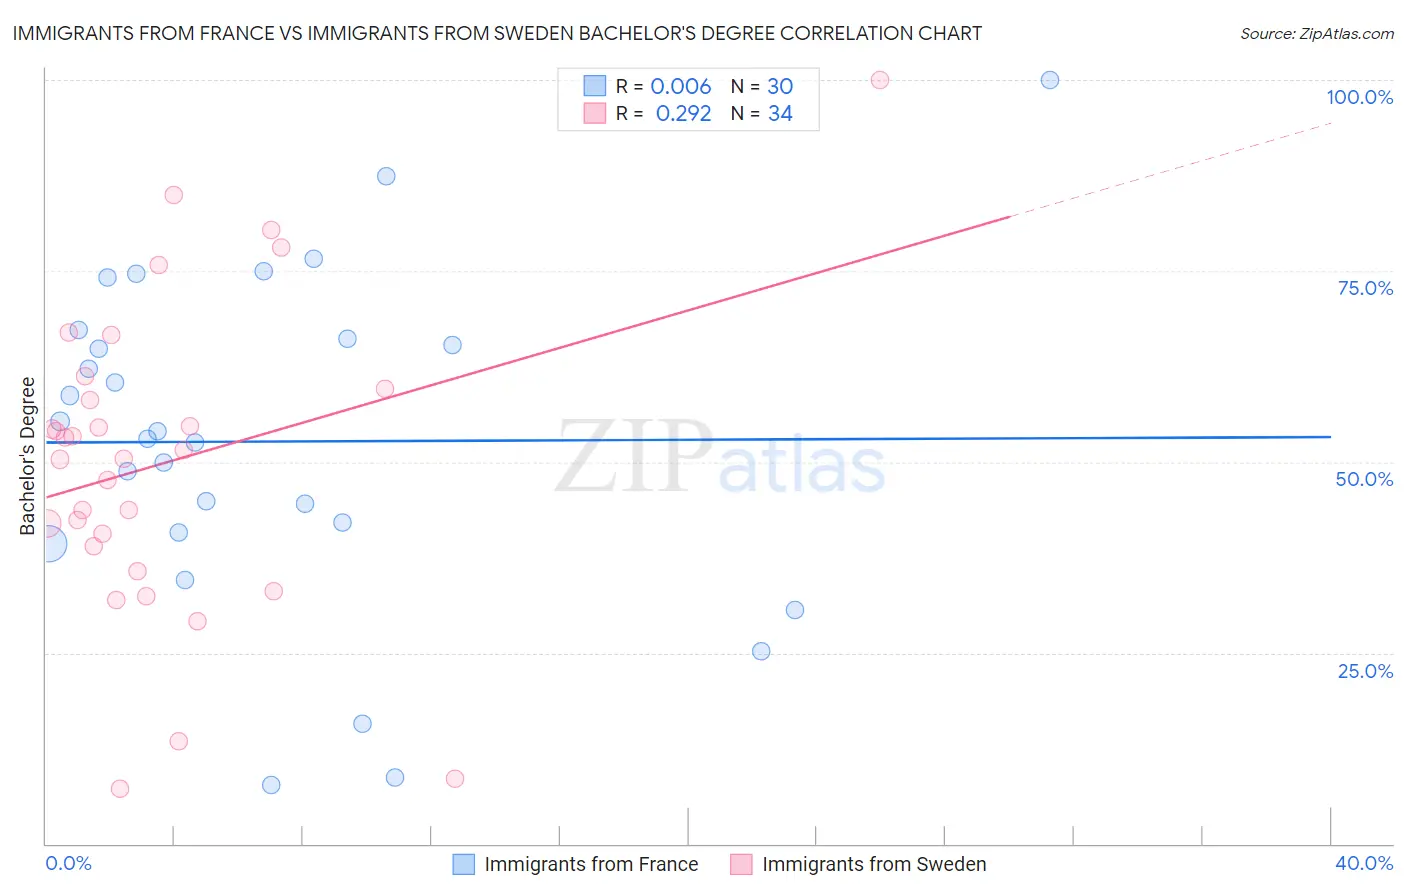
Immigrants from France vs Immigrants from Sweden Bachelor's Degree Correlation Chart
The statistical analysis conducted on geographies consisting of 287,908,561 people shows no correlation between the proportion of Immigrants from France and percentage of population with at least bachelor's degree education in the United States with a correlation coefficient (R) of 0.006 and weighted average of 46.4%. Similarly, the statistical analysis conducted on geographies consisting of 164,727,727 people shows a weak positive correlation between the proportion of Immigrants from Sweden and percentage of population with at least bachelor's degree education in the United States with a correlation coefficient (R) of 0.292 and weighted average of 47.0%, a difference of 1.3%.
Bachelor's Degree Correlation Summary
| Measurement | Immigrants from France | Immigrants from Sweden |
| Minimum | 7.7% | 7.1% |
| Maximum | 100.0% | 100.0% |
| Range | 92.3% | 92.9% |
| Mean | 52.7% | 49.9% |
| Median | 53.5% | 51.0% |
| Interquartile 25% (IQ1) | 40.8% | 39.0% |
| Interquartile 75% (IQ3) | 66.2% | 59.6% |
| Interquartile Range (IQR) | 25.3% | 20.6% |
| Standard Deviation (Sample) | 21.8% | 20.5% |
| Standard Deviation (Population) | 21.5% | 20.2% |
Demographics Similar to Immigrants from France and Immigrants from Sweden by Bachelor's Degree
In terms of bachelor's degree, the demographic groups most similar to Immigrants from France are Turkish (46.2%, a difference of 0.46%), Israeli (46.1%, a difference of 0.59%), Immigrants from Sri Lanka (46.1%, a difference of 0.64%), Latvian (46.1%, a difference of 0.68%), and Immigrants from Japan (46.8%, a difference of 0.91%). Similarly, the demographic groups most similar to Immigrants from Sweden are Immigrants from Korea (47.0%, a difference of 0.040%), Immigrants from Belgium (47.0%, a difference of 0.090%), Burmese (46.9%, a difference of 0.26%), Immigrants from Ireland (47.1%, a difference of 0.29%), and Immigrants from Switzerland (47.1%, a difference of 0.30%).
| Demographics | Rating | Rank | Bachelor's Degree |
| Immigrants | Eastern Asia | 100.0 /100 | #15 | Exceptional 48.1% |
| Soviet Union | 100.0 /100 | #16 | Exceptional 47.9% |
| Eastern Europeans | 100.0 /100 | #17 | Exceptional 47.5% |
| Indians (Asian) | 100.0 /100 | #18 | Exceptional 47.4% |
| Cambodians | 100.0 /100 | #19 | Exceptional 47.2% |
| Immigrants | Switzerland | 100.0 /100 | #20 | Exceptional 47.1% |
| Immigrants | Ireland | 100.0 /100 | #21 | Exceptional 47.1% |
| Immigrants | Belgium | 100.0 /100 | #22 | Exceptional 47.0% |
| Immigrants | Sweden | 100.0 /100 | #23 | Exceptional 47.0% |
| Immigrants | Korea | 100.0 /100 | #24 | Exceptional 47.0% |
| Burmese | 100.0 /100 | #25 | Exceptional 46.9% |
| Immigrants | Japan | 100.0 /100 | #26 | Exceptional 46.8% |
| Immigrants | France | 100.0 /100 | #27 | Exceptional 46.4% |
| Turks | 100.0 /100 | #28 | Exceptional 46.2% |
| Israelis | 100.0 /100 | #29 | Exceptional 46.1% |
| Immigrants | Sri Lanka | 100.0 /100 | #30 | Exceptional 46.1% |
| Latvians | 100.0 /100 | #31 | Exceptional 46.1% |
| Immigrants | Turkey | 100.0 /100 | #32 | Exceptional 46.0% |
| Immigrants | Northern Europe | 100.0 /100 | #33 | Exceptional 45.6% |
| Immigrants | Denmark | 100.0 /100 | #34 | Exceptional 45.4% |
| Immigrants | Russia | 100.0 /100 | #35 | Exceptional 45.4% |