Immigrants from France vs Greek Kindergarten
COMPARE
Immigrants from France
Greek
Kindergarten
Kindergarten Comparison
Immigrants from France
Greeks
98.2%
KINDERGARTEN
95.5/ 100
METRIC RATING
117th/ 347
METRIC RANK
98.4%
KINDERGARTEN
99.7/ 100
METRIC RATING
64th/ 347
METRIC RANK
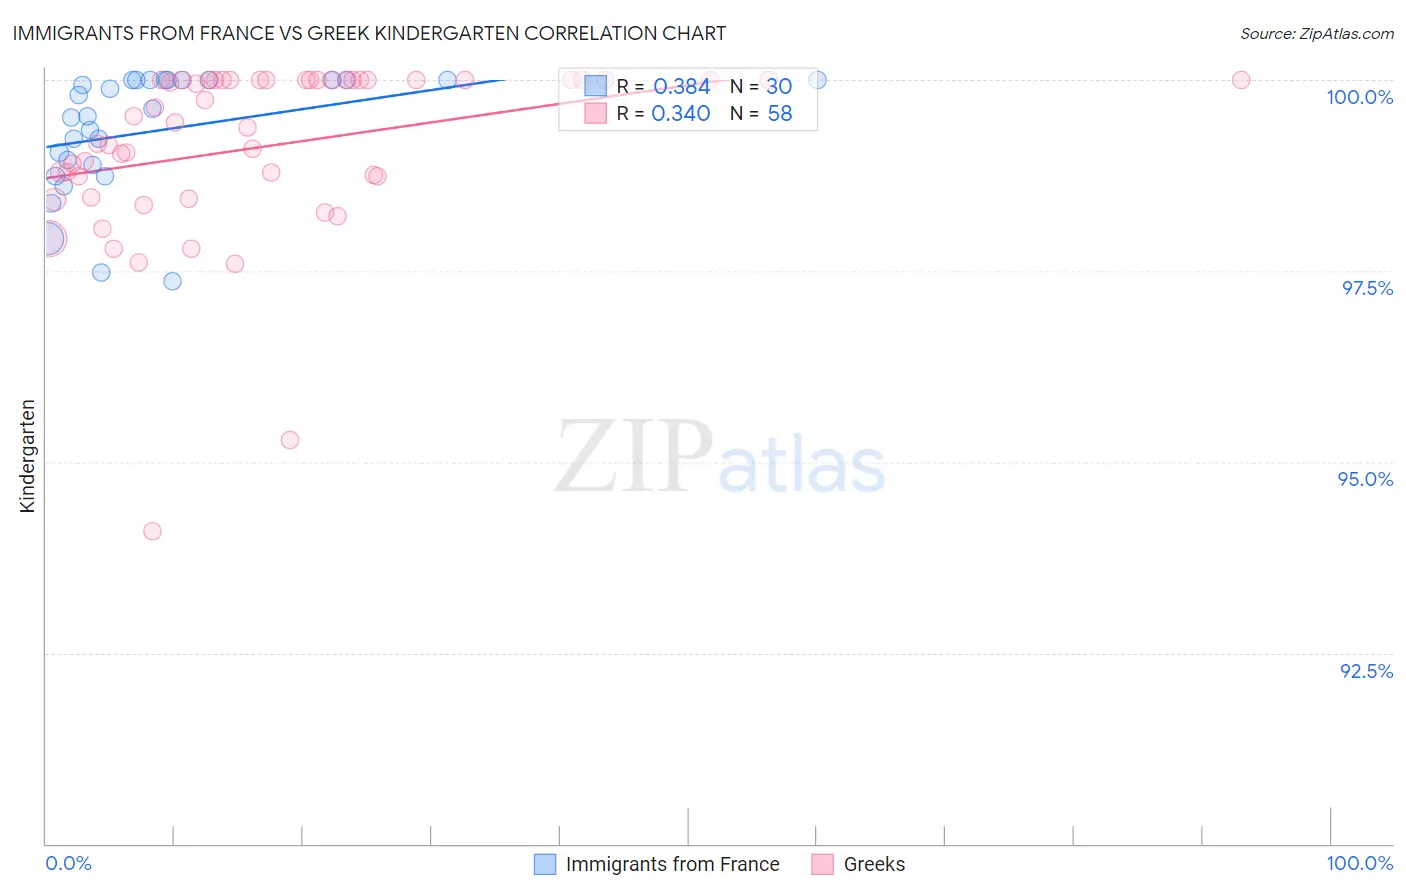
Immigrants from France vs Greek Kindergarten Correlation Chart
The statistical analysis conducted on geographies consisting of 287,920,814 people shows a mild positive correlation between the proportion of Immigrants from France and percentage of population with at least kindergarten education in the United States with a correlation coefficient (R) of 0.384 and weighted average of 98.2%. Similarly, the statistical analysis conducted on geographies consisting of 482,775,358 people shows a mild positive correlation between the proportion of Greeks and percentage of population with at least kindergarten education in the United States with a correlation coefficient (R) of 0.340 and weighted average of 98.4%, a difference of 0.22%.
Kindergarten Correlation Summary
| Measurement | Immigrants from France | Greek |
| Minimum | 97.4% | 94.1% |
| Maximum | 100.0% | 100.0% |
| Range | 2.6% | 5.9% |
| Mean | 99.3% | 99.1% |
| Median | 99.6% | 99.5% |
| Interquartile 25% (IQ1) | 98.9% | 98.7% |
| Interquartile 75% (IQ3) | 100.0% | 100.0% |
| Interquartile Range (IQR) | 1.1% | 1.3% |
| Standard Deviation (Sample) | 0.78% | 1.2% |
| Standard Deviation (Population) | 0.77% | 1.1% |
Similar Demographics by Kindergarten
Demographics Similar to Immigrants from France by Kindergarten
In terms of kindergarten, the demographic groups most similar to Immigrants from France are Yugoslavian (98.2%, a difference of 0.0%), Iranian (98.2%, a difference of 0.010%), Spanish (98.2%, a difference of 0.010%), Thai (98.2%, a difference of 0.010%), and Immigrants from Norway (98.2%, a difference of 0.020%).
| Demographics | Rating | Rank | Kindergarten |
| Immigrants | Singapore | 96.8 /100 | #110 | Exceptional 98.2% |
| Immigrants | Norway | 96.6 /100 | #111 | Exceptional 98.2% |
| Immigrants | Czechoslovakia | 96.6 /100 | #112 | Exceptional 98.2% |
| Immigrants | Latvia | 96.3 /100 | #113 | Exceptional 98.2% |
| Ute | 96.3 /100 | #114 | Exceptional 98.2% |
| Iranians | 96.2 /100 | #115 | Exceptional 98.2% |
| Spanish | 95.8 /100 | #116 | Exceptional 98.2% |
| Immigrants | France | 95.5 /100 | #117 | Exceptional 98.2% |
| Yugoslavians | 95.5 /100 | #118 | Exceptional 98.2% |
| Thais | 94.8 /100 | #119 | Exceptional 98.2% |
| Okinawans | 94.4 /100 | #120 | Exceptional 98.2% |
| Immigrants | Zimbabwe | 94.0 /100 | #121 | Exceptional 98.2% |
| Immigrants | Japan | 94.0 /100 | #122 | Exceptional 98.2% |
| Menominee | 93.9 /100 | #123 | Exceptional 98.2% |
| Syrians | 93.6 /100 | #124 | Exceptional 98.2% |
Demographics Similar to Greeks by Kindergarten
In terms of kindergarten, the demographic groups most similar to Greeks are Slavic (98.4%, a difference of 0.0%), New Zealander (98.4%, a difference of 0.0%), Immigrants from North America (98.4%, a difference of 0.0%), Maltese (98.4%, a difference of 0.0%), and Austrian (98.4%, a difference of 0.010%).
| Demographics | Rating | Rank | Kindergarten |
| Austrians | 99.8 /100 | #57 | Exceptional 98.4% |
| Bulgarians | 99.7 /100 | #58 | Exceptional 98.4% |
| Immigrants | Canada | 99.7 /100 | #59 | Exceptional 98.4% |
| Creek | 99.7 /100 | #60 | Exceptional 98.4% |
| Slavs | 99.7 /100 | #61 | Exceptional 98.4% |
| New Zealanders | 99.7 /100 | #62 | Exceptional 98.4% |
| Immigrants | North America | 99.7 /100 | #63 | Exceptional 98.4% |
| Greeks | 99.7 /100 | #64 | Exceptional 98.4% |
| Maltese | 99.7 /100 | #65 | Exceptional 98.4% |
| Cheyenne | 99.6 /100 | #66 | Exceptional 98.4% |
| Canadians | 99.6 /100 | #67 | Exceptional 98.4% |
| Immigrants | Northern Europe | 99.6 /100 | #68 | Exceptional 98.4% |
| Immigrants | Austria | 99.6 /100 | #69 | Exceptional 98.4% |
| Russians | 99.6 /100 | #70 | Exceptional 98.4% |
| Chickasaw | 99.6 /100 | #71 | Exceptional 98.4% |