Immigrants from France vs Crow 6th Grade
COMPARE
Immigrants from France
Crow
6th Grade
6th Grade Comparison
Immigrants from France
Crow
97.4%
6TH GRADE
94.5/ 100
METRIC RATING
122nd/ 347
METRIC RANK
99.4%
6TH GRADE
100.0/ 100
METRIC RATING
1st/ 347
METRIC RANK
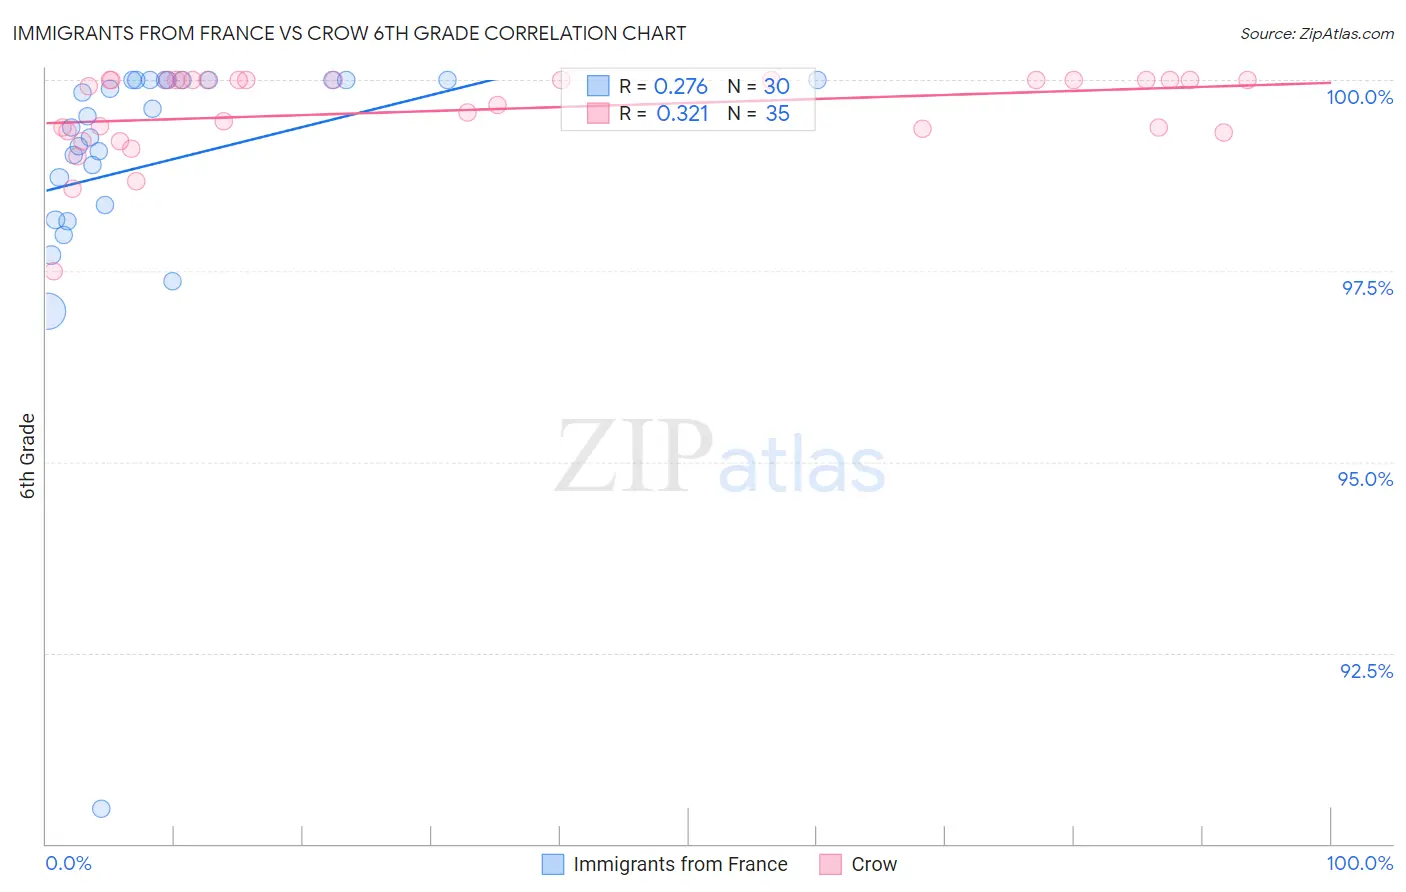
Immigrants from France vs Crow 6th Grade Correlation Chart
The statistical analysis conducted on geographies consisting of 287,920,814 people shows a weak positive correlation between the proportion of Immigrants from France and percentage of population with at least 6th grade education in the United States with a correlation coefficient (R) of 0.276 and weighted average of 97.4%. Similarly, the statistical analysis conducted on geographies consisting of 665,246 people shows a mild positive correlation between the proportion of Crow and percentage of population with at least 6th grade education in the United States with a correlation coefficient (R) of 0.321 and weighted average of 99.4%, a difference of 2.1%.
6th Grade Correlation Summary
| Measurement | Immigrants from France | Crow |
| Minimum | 90.5% | 97.5% |
| Maximum | 100.0% | 100.0% |
| Range | 9.5% | 2.5% |
| Mean | 98.9% | 99.6% |
| Median | 99.4% | 100.0% |
| Interquartile 25% (IQ1) | 98.4% | 99.3% |
| Interquartile 75% (IQ3) | 100.0% | 100.0% |
| Interquartile Range (IQR) | 1.6% | 0.68% |
| Standard Deviation (Sample) | 1.8% | 0.56% |
| Standard Deviation (Population) | 1.8% | 0.55% |
Similar Demographics by 6th Grade
Demographics Similar to Immigrants from France by 6th Grade
In terms of 6th grade, the demographic groups most similar to Immigrants from France are Immigrants from Norway (97.4%, a difference of 0.0%), Hmong (97.4%, a difference of 0.0%), Immigrants from Zimbabwe (97.4%, a difference of 0.010%), Syrian (97.4%, a difference of 0.010%), and Okinawan (97.4%, a difference of 0.010%).
| Demographics | Rating | Rank | 6th Grade |
| Immigrants | Switzerland | 95.7 /100 | #115 | Exceptional 97.4% |
| Lebanese | 95.5 /100 | #116 | Exceptional 97.4% |
| Basques | 95.4 /100 | #117 | Exceptional 97.4% |
| Immigrants | Japan | 95.2 /100 | #118 | Exceptional 97.4% |
| Immigrants | Zimbabwe | 95.0 /100 | #119 | Exceptional 97.4% |
| Syrians | 94.8 /100 | #120 | Exceptional 97.4% |
| Immigrants | Norway | 94.7 /100 | #121 | Exceptional 97.4% |
| Immigrants | France | 94.5 /100 | #122 | Exceptional 97.4% |
| Hmong | 94.4 /100 | #123 | Exceptional 97.4% |
| Okinawans | 94.2 /100 | #124 | Exceptional 97.4% |
| Spanish | 93.7 /100 | #125 | Exceptional 97.3% |
| Immigrants | Bulgaria | 93.6 /100 | #126 | Exceptional 97.3% |
| Immigrants | Croatia | 93.1 /100 | #127 | Exceptional 97.3% |
| Immigrants | Romania | 92.0 /100 | #128 | Exceptional 97.3% |
| Immigrants | Serbia | 91.9 /100 | #129 | Exceptional 97.3% |
Demographics Similar to Crow by 6th Grade
In terms of 6th grade, the demographic groups most similar to Crow are Ottawa (98.5%, a difference of 0.88%), Welsh (98.5%, a difference of 0.89%), Dutch (98.4%, a difference of 1.0%), Tsimshian (98.3%, a difference of 1.1%), and Norwegian (98.3%, a difference of 1.1%).
| Demographics | Rating | Rank | 6th Grade |
| Crow | 100.0 /100 | #1 | Exceptional 99.4% |
| Ottawa | 100.0 /100 | #2 | Exceptional 98.5% |
| Welsh | 100.0 /100 | #3 | Exceptional 98.5% |
| Dutch | 100.0 /100 | #4 | Exceptional 98.4% |
| Tsimshian | 100.0 /100 | #5 | Exceptional 98.3% |
| Norwegians | 100.0 /100 | #6 | Exceptional 98.3% |
| Germans | 100.0 /100 | #7 | Exceptional 98.2% |
| Slovaks | 100.0 /100 | #8 | Exceptional 98.2% |
| Slovenes | 100.0 /100 | #9 | Exceptional 98.2% |
| Swedes | 100.0 /100 | #10 | Exceptional 98.2% |
| English | 100.0 /100 | #11 | Exceptional 98.1% |
| Alaskan Athabascans | 100.0 /100 | #12 | Exceptional 98.1% |
| Tlingit-Haida | 100.0 /100 | #13 | Exceptional 98.1% |
| Carpatho Rusyns | 100.0 /100 | #14 | Exceptional 98.1% |
| Inupiat | 100.0 /100 | #15 | Exceptional 98.1% |