Immigrants from Fiji vs Eastern European Nursery School
COMPARE
Immigrants from Fiji
Eastern European
Nursery School
Nursery School Comparison
Immigrants from Fiji
Eastern Europeans
96.5%
NURSERY SCHOOL
0.0/ 100
METRIC RATING
338th/ 347
METRIC RANK
98.5%
NURSERY SCHOOL
99.9/ 100
METRIC RATING
42nd/ 347
METRIC RANK
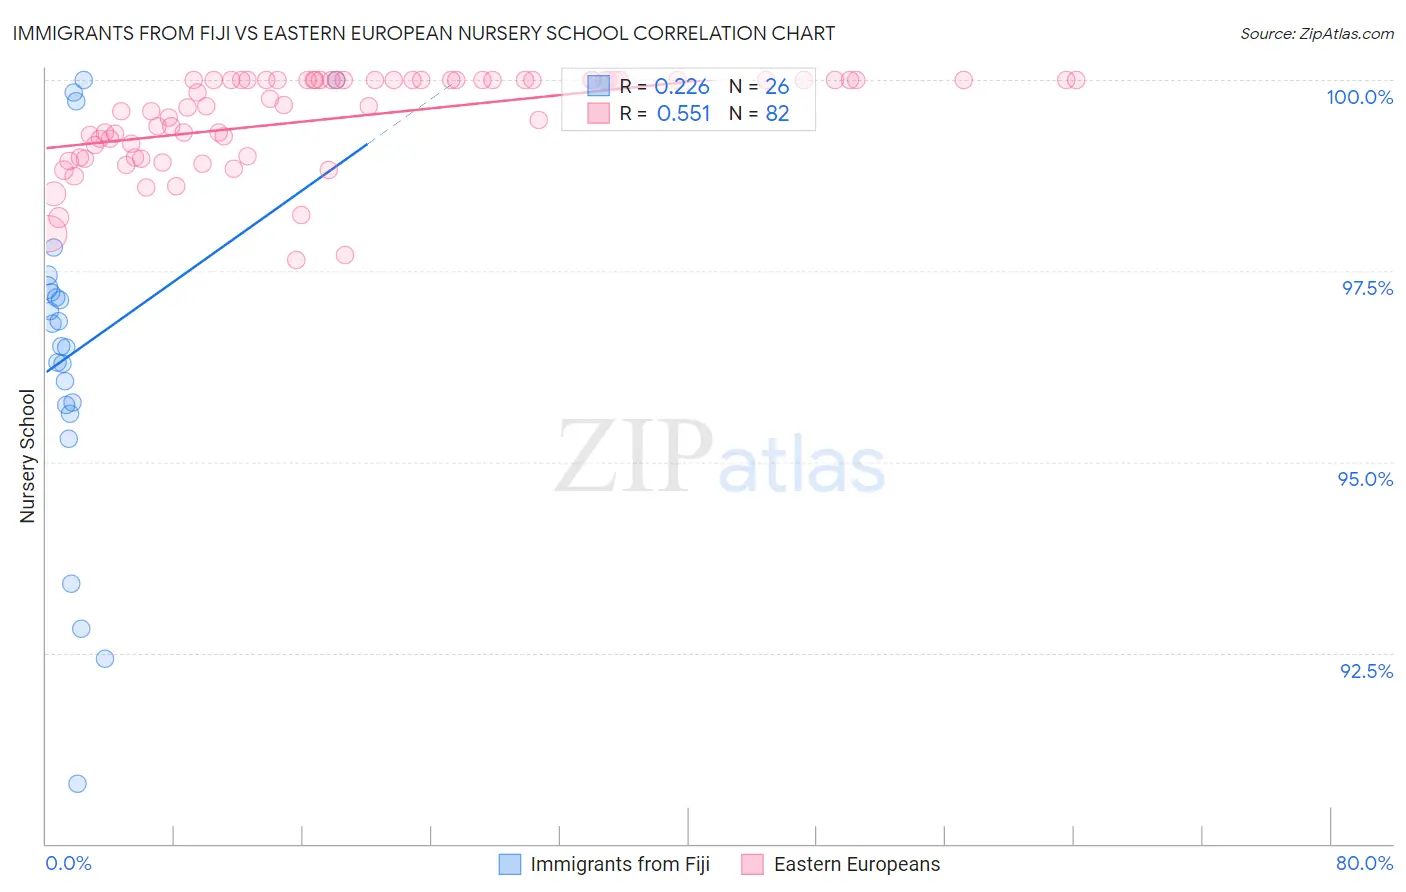
Immigrants from Fiji vs Eastern European Nursery School Correlation Chart
The statistical analysis conducted on geographies consisting of 93,756,204 people shows a weak positive correlation between the proportion of Immigrants from Fiji and percentage of population with at least nursery school education in the United States with a correlation coefficient (R) of 0.226 and weighted average of 96.5%. Similarly, the statistical analysis conducted on geographies consisting of 461,247,661 people shows a substantial positive correlation between the proportion of Eastern Europeans and percentage of population with at least nursery school education in the United States with a correlation coefficient (R) of 0.551 and weighted average of 98.5%, a difference of 2.1%.
Nursery School Correlation Summary
| Measurement | Immigrants from Fiji | Eastern European |
| Minimum | 90.8% | 97.7% |
| Maximum | 100.0% | 100.0% |
| Range | 9.2% | 2.3% |
| Mean | 96.5% | 99.5% |
| Median | 96.7% | 99.7% |
| Interquartile 25% (IQ1) | 95.7% | 99.0% |
| Interquartile 75% (IQ3) | 97.3% | 100.0% |
| Interquartile Range (IQR) | 1.5% | 1.00% |
| Standard Deviation (Sample) | 2.3% | 0.61% |
| Standard Deviation (Population) | 2.2% | 0.61% |
Similar Demographics by Nursery School
Demographics Similar to Immigrants from Fiji by Nursery School
In terms of nursery school, the demographic groups most similar to Immigrants from Fiji are Immigrants from Cambodia (96.5%, a difference of 0.0%), Guatemalan (96.6%, a difference of 0.040%), Bangladeshi (96.6%, a difference of 0.070%), Immigrants from Guatemala (96.4%, a difference of 0.080%), and Immigrants from Dominican Republic (96.6%, a difference of 0.090%).
| Demographics | Rating | Rank | Nursery School |
| Immigrants | Armenia | 0.0 /100 | #331 | Tragic 96.7% |
| Yakama | 0.0 /100 | #332 | Tragic 96.6% |
| Central Americans | 0.0 /100 | #333 | Tragic 96.6% |
| Immigrants | Dominican Republic | 0.0 /100 | #334 | Tragic 96.6% |
| Bangladeshis | 0.0 /100 | #335 | Tragic 96.6% |
| Guatemalans | 0.0 /100 | #336 | Tragic 96.6% |
| Immigrants | Cambodia | 0.0 /100 | #337 | Tragic 96.5% |
| Immigrants | Fiji | 0.0 /100 | #338 | Tragic 96.5% |
| Immigrants | Guatemala | 0.0 /100 | #339 | Tragic 96.4% |
| Immigrants | Central America | 0.0 /100 | #340 | Tragic 96.4% |
| Immigrants | Cabo Verde | 0.0 /100 | #341 | Tragic 96.4% |
| Immigrants | Mexico | 0.0 /100 | #342 | Tragic 96.4% |
| Salvadorans | 0.0 /100 | #343 | Tragic 96.4% |
| Immigrants | El Salvador | 0.0 /100 | #344 | Tragic 96.2% |
| Nepalese | 0.0 /100 | #345 | Tragic 96.2% |
Demographics Similar to Eastern Europeans by Nursery School
In terms of nursery school, the demographic groups most similar to Eastern Europeans are Luxembourger (98.5%, a difference of 0.0%), Native Hawaiian (98.5%, a difference of 0.0%), Latvian (98.5%, a difference of 0.010%), Chippewa (98.5%, a difference of 0.010%), and Belgian (98.5%, a difference of 0.010%).
| Demographics | Rating | Rank | Nursery School |
| Swiss | 100.0 /100 | #35 | Exceptional 98.6% |
| British | 100.0 /100 | #36 | Exceptional 98.5% |
| Lumbee | 99.9 /100 | #37 | Exceptional 98.5% |
| Italians | 99.9 /100 | #38 | Exceptional 98.5% |
| Latvians | 99.9 /100 | #39 | Exceptional 98.5% |
| Chippewa | 99.9 /100 | #40 | Exceptional 98.5% |
| Luxembourgers | 99.9 /100 | #41 | Exceptional 98.5% |
| Eastern Europeans | 99.9 /100 | #42 | Exceptional 98.5% |
| Native Hawaiians | 99.9 /100 | #43 | Exceptional 98.5% |
| Belgians | 99.9 /100 | #44 | Exceptional 98.5% |
| Northern Europeans | 99.9 /100 | #45 | Exceptional 98.5% |
| Hungarians | 99.9 /100 | #46 | Exceptional 98.5% |
| Czechoslovakians | 99.9 /100 | #47 | Exceptional 98.5% |
| Ottawa | 99.8 /100 | #48 | Exceptional 98.5% |
| Whites/Caucasians | 99.8 /100 | #49 | Exceptional 98.5% |