Immigrants from Europe vs Kiowa Nursery School
COMPARE
Immigrants from Europe
Kiowa
Nursery School
Nursery School Comparison
Immigrants from Europe
Kiowa
98.1%
NURSERY SCHOOL
90.7/ 100
METRIC RATING
133rd/ 347
METRIC RANK
98.4%
NURSERY SCHOOL
99.8/ 100
METRIC RATING
53rd/ 347
METRIC RANK
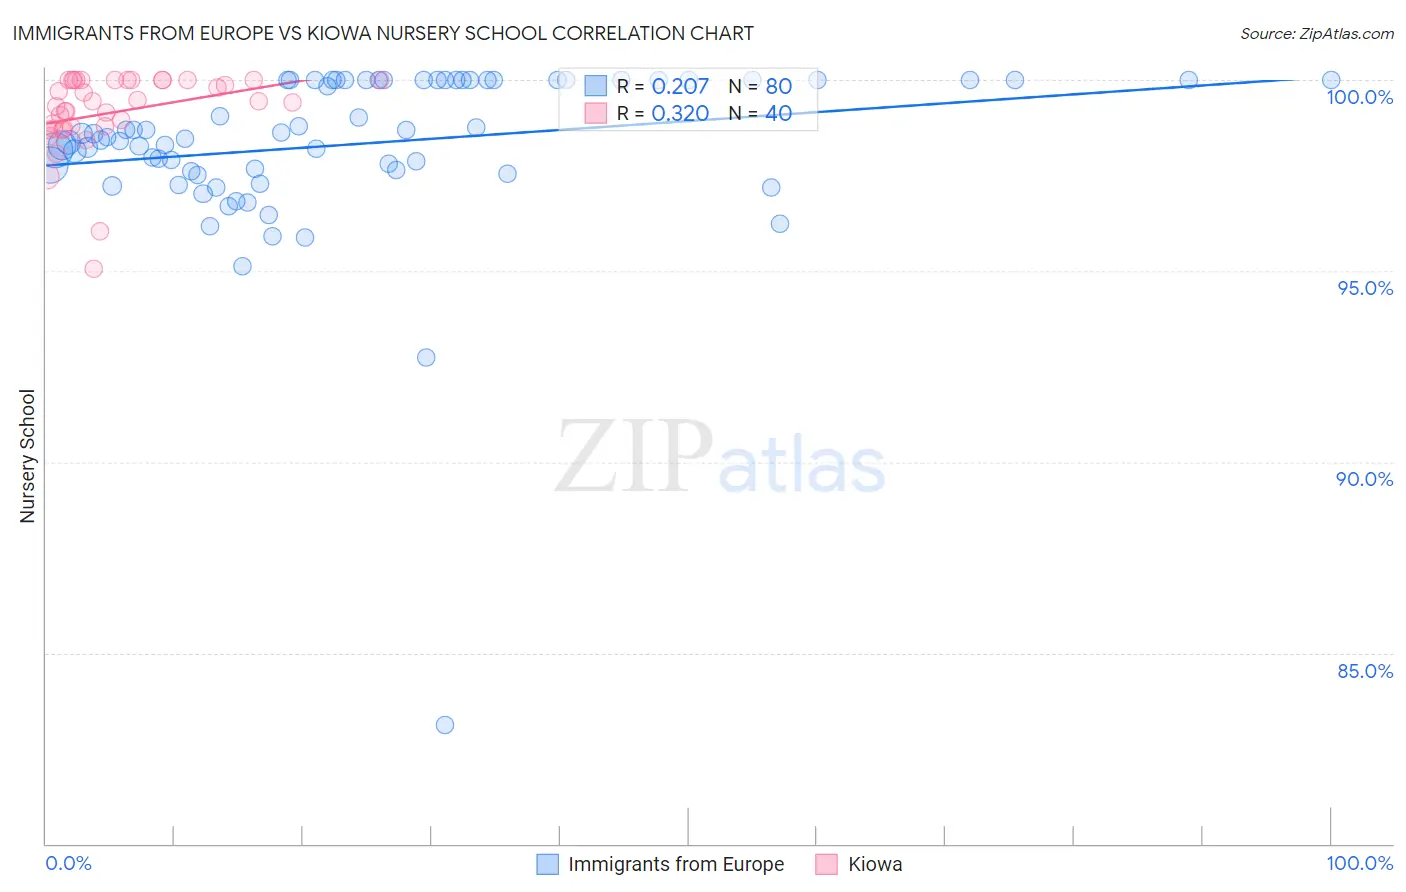
Immigrants from Europe vs Kiowa Nursery School Correlation Chart
The statistical analysis conducted on geographies consisting of 547,425,973 people shows a weak positive correlation between the proportion of Immigrants from Europe and percentage of population with at least nursery school education in the United States with a correlation coefficient (R) of 0.207 and weighted average of 98.1%. Similarly, the statistical analysis conducted on geographies consisting of 56,100,633 people shows a mild positive correlation between the proportion of Kiowa and percentage of population with at least nursery school education in the United States with a correlation coefficient (R) of 0.320 and weighted average of 98.4%, a difference of 0.30%.
Nursery School Correlation Summary
| Measurement | Immigrants from Europe | Kiowa |
| Minimum | 83.1% | 95.0% |
| Maximum | 100.0% | 100.0% |
| Range | 16.9% | 5.0% |
| Mean | 98.3% | 99.2% |
| Median | 98.5% | 99.4% |
| Interquartile 25% (IQ1) | 97.6% | 98.8% |
| Interquartile 75% (IQ3) | 100.0% | 100.0% |
| Interquartile Range (IQR) | 2.4% | 1.2% |
| Standard Deviation (Sample) | 2.2% | 1.1% |
| Standard Deviation (Population) | 2.2% | 1.0% |
Similar Demographics by Nursery School
Demographics Similar to Immigrants from Europe by Nursery School
In terms of nursery school, the demographic groups most similar to Immigrants from Europe are Spaniard (98.2%, a difference of 0.0%), Seminole (98.2%, a difference of 0.0%), Cambodian (98.2%, a difference of 0.010%), Immigrants from Croatia (98.2%, a difference of 0.010%), and Immigrants from Bulgaria (98.1%, a difference of 0.010%).
| Demographics | Rating | Rank | Nursery School |
| Menominee | 93.6 /100 | #126 | Exceptional 98.2% |
| Immigrants | Saudi Arabia | 93.4 /100 | #127 | Exceptional 98.2% |
| Immigrants | Serbia | 92.4 /100 | #128 | Exceptional 98.2% |
| Cambodians | 91.4 /100 | #129 | Exceptional 98.2% |
| Immigrants | Croatia | 91.4 /100 | #130 | Exceptional 98.2% |
| Spaniards | 91.1 /100 | #131 | Exceptional 98.2% |
| Seminole | 90.9 /100 | #132 | Exceptional 98.2% |
| Immigrants | Europe | 90.7 /100 | #133 | Exceptional 98.1% |
| Immigrants | Bulgaria | 89.4 /100 | #134 | Excellent 98.1% |
| Immigrants | Hungary | 89.3 /100 | #135 | Excellent 98.1% |
| Immigrants | Kuwait | 88.9 /100 | #136 | Excellent 98.1% |
| Israelis | 88.2 /100 | #137 | Excellent 98.1% |
| Immigrants | Romania | 88.0 /100 | #138 | Excellent 98.1% |
| Blackfeet | 87.5 /100 | #139 | Excellent 98.1% |
| Palestinians | 83.7 /100 | #140 | Excellent 98.1% |
Demographics Similar to Kiowa by Nursery School
In terms of nursery school, the demographic groups most similar to Kiowa are Pueblo (98.4%, a difference of 0.0%), Ottawa (98.5%, a difference of 0.010%), White/Caucasian (98.5%, a difference of 0.010%), Celtic (98.5%, a difference of 0.010%), and Estonian (98.5%, a difference of 0.010%).
| Demographics | Rating | Rank | Nursery School |
| Hungarians | 99.9 /100 | #46 | Exceptional 98.5% |
| Czechoslovakians | 99.9 /100 | #47 | Exceptional 98.5% |
| Ottawa | 99.8 /100 | #48 | Exceptional 98.5% |
| Whites/Caucasians | 99.8 /100 | #49 | Exceptional 98.5% |
| Celtics | 99.8 /100 | #50 | Exceptional 98.5% |
| Estonians | 99.8 /100 | #51 | Exceptional 98.5% |
| Australians | 99.8 /100 | #52 | Exceptional 98.5% |
| Kiowa | 99.8 /100 | #53 | Exceptional 98.4% |
| Pueblo | 99.8 /100 | #54 | Exceptional 98.4% |
| Immigrants | Scotland | 99.8 /100 | #55 | Exceptional 98.4% |
| Americans | 99.8 /100 | #56 | Exceptional 98.4% |
| Austrians | 99.8 /100 | #57 | Exceptional 98.4% |
| Bulgarians | 99.8 /100 | #58 | Exceptional 98.4% |
| Immigrants | Canada | 99.8 /100 | #59 | Exceptional 98.4% |
| Slavs | 99.8 /100 | #60 | Exceptional 98.4% |