Immigrants from Europe vs Immigrants from Greece 4th Grade
COMPARE
Immigrants from Europe
Immigrants from Greece
4th Grade
4th Grade Comparison
Immigrants from Europe
Immigrants from Greece
97.8%
4TH GRADE
92.5/ 100
METRIC RATING
126th/ 347
METRIC RANK
97.7%
4TH GRADE
83.8/ 100
METRIC RATING
141st/ 347
METRIC RANK
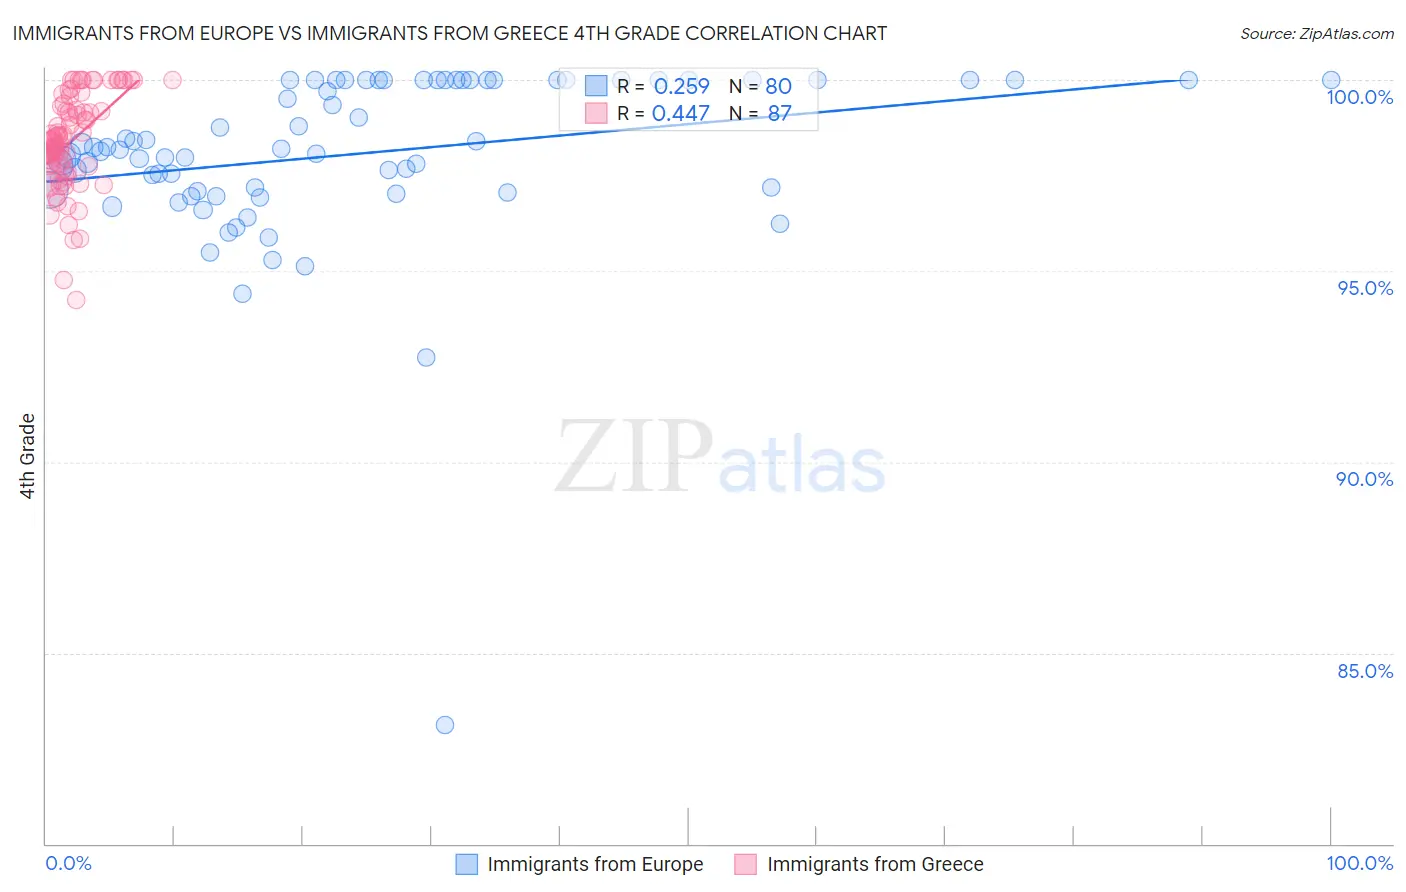
Immigrants from Europe vs Immigrants from Greece 4th Grade Correlation Chart
The statistical analysis conducted on geographies consisting of 547,425,973 people shows a weak positive correlation between the proportion of Immigrants from Europe and percentage of population with at least 4th grade education in the United States with a correlation coefficient (R) of 0.259 and weighted average of 97.8%. Similarly, the statistical analysis conducted on geographies consisting of 216,879,847 people shows a moderate positive correlation between the proportion of Immigrants from Greece and percentage of population with at least 4th grade education in the United States with a correlation coefficient (R) of 0.447 and weighted average of 97.7%, a difference of 0.080%.
4th Grade Correlation Summary
| Measurement | Immigrants from Europe | Immigrants from Greece |
| Minimum | 83.1% | 94.3% |
| Maximum | 100.0% | 100.0% |
| Range | 16.9% | 5.7% |
| Mean | 98.1% | 98.4% |
| Median | 98.2% | 98.5% |
| Interquartile 25% (IQ1) | 97.1% | 97.8% |
| Interquartile 75% (IQ3) | 100.0% | 99.3% |
| Interquartile Range (IQR) | 2.9% | 1.6% |
| Standard Deviation (Sample) | 2.3% | 1.2% |
| Standard Deviation (Population) | 2.3% | 1.2% |
Demographics Similar to Immigrants from Europe and Immigrants from Greece by 4th Grade
In terms of 4th grade, the demographic groups most similar to Immigrants from Europe are Immigrants from Serbia (97.8%, a difference of 0.0%), Colville (97.7%, a difference of 0.0%), Pima (97.7%, a difference of 0.010%), Immigrants from Bulgaria (97.7%, a difference of 0.010%), and Immigrants from Zimbabwe (97.8%, a difference of 0.020%). Similarly, the demographic groups most similar to Immigrants from Greece are Filipino (97.7%, a difference of 0.0%), Immigrants from North Macedonia (97.7%, a difference of 0.0%), Seminole (97.7%, a difference of 0.010%), Burmese (97.7%, a difference of 0.010%), and Israeli (97.7%, a difference of 0.020%).
| Demographics | Rating | Rank | 4th Grade |
| Immigrants | Zimbabwe | 93.9 /100 | #123 | Exceptional 97.8% |
| Spanish | 93.7 /100 | #124 | Exceptional 97.8% |
| Immigrants | Serbia | 92.6 /100 | #125 | Exceptional 97.8% |
| Immigrants | Europe | 92.5 /100 | #126 | Exceptional 97.8% |
| Colville | 92.3 /100 | #127 | Exceptional 97.7% |
| Pima | 92.0 /100 | #128 | Exceptional 97.7% |
| Immigrants | Bulgaria | 91.3 /100 | #129 | Exceptional 97.7% |
| Immigrants | Romania | 90.6 /100 | #130 | Exceptional 97.7% |
| Immigrants | Kuwait | 89.7 /100 | #131 | Excellent 97.7% |
| Immigrants | Hungary | 89.3 /100 | #132 | Excellent 97.7% |
| Hmong | 88.2 /100 | #133 | Excellent 97.7% |
| Palestinians | 88.1 /100 | #134 | Excellent 97.7% |
| Cambodians | 87.8 /100 | #135 | Excellent 97.7% |
| Israelis | 86.2 /100 | #136 | Excellent 97.7% |
| Immigrants | Turkey | 86.0 /100 | #137 | Excellent 97.7% |
| Blackfeet | 86.0 /100 | #138 | Excellent 97.7% |
| Seminole | 84.7 /100 | #139 | Excellent 97.7% |
| Filipinos | 84.0 /100 | #140 | Excellent 97.7% |
| Immigrants | Greece | 83.8 /100 | #141 | Excellent 97.7% |
| Immigrants | North Macedonia | 83.3 /100 | #142 | Excellent 97.7% |
| Burmese | 82.8 /100 | #143 | Excellent 97.7% |