Immigrants from Europe vs Eastern European 2nd Grade
COMPARE
Immigrants from Europe
Eastern European
2nd Grade
2nd Grade Comparison
Immigrants from Europe
Eastern Europeans
98.0%
2ND GRADE
91.1/ 100
METRIC RATING
131st/ 347
METRIC RANK
98.4%
2ND GRADE
99.9/ 100
METRIC RATING
41st/ 347
METRIC RANK
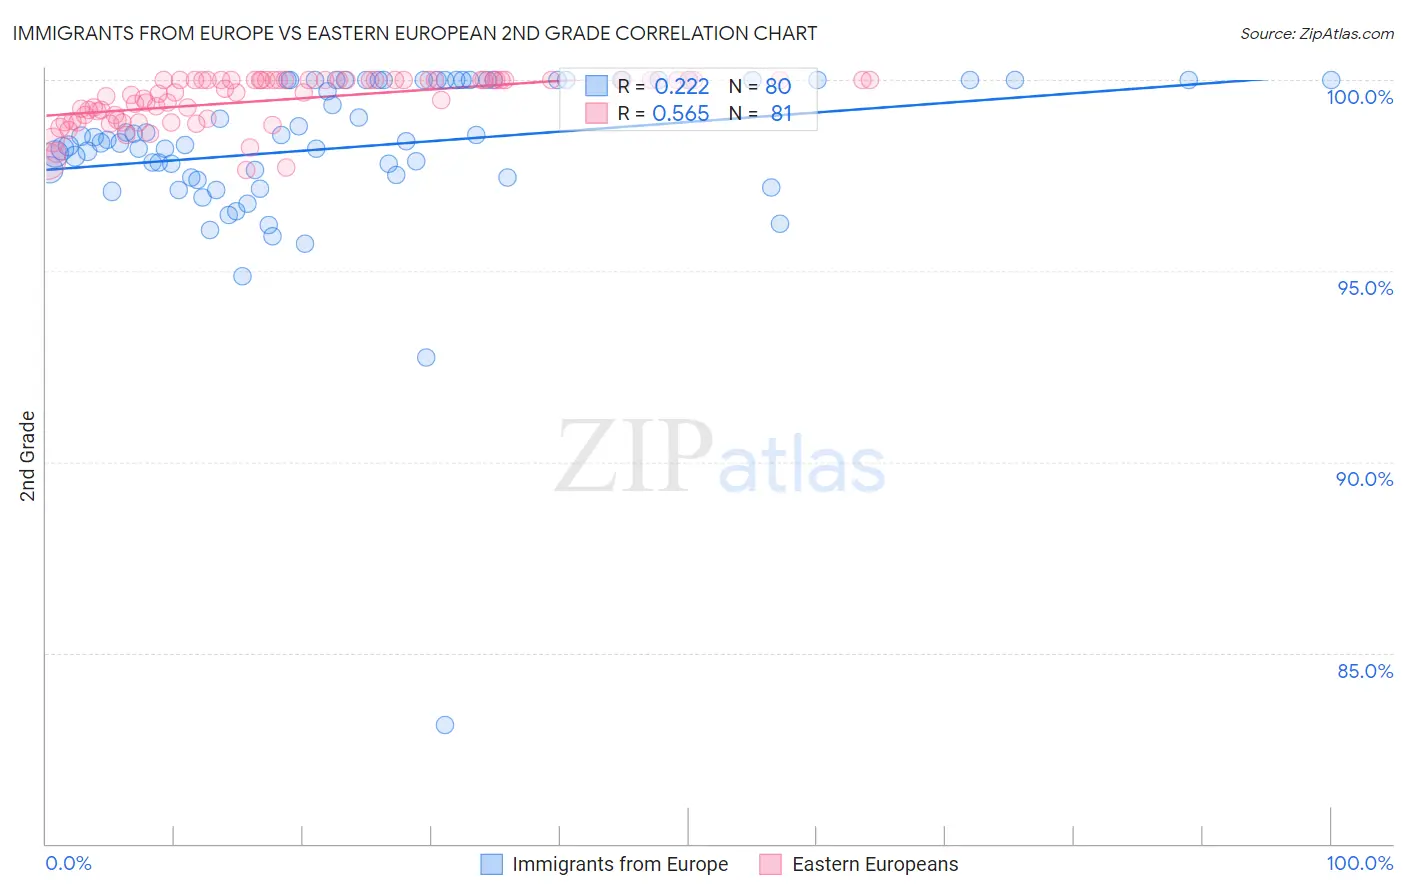
Immigrants from Europe vs Eastern European 2nd Grade Correlation Chart
The statistical analysis conducted on geographies consisting of 547,425,973 people shows a weak positive correlation between the proportion of Immigrants from Europe and percentage of population with at least 2nd grade education in the United States with a correlation coefficient (R) of 0.222 and weighted average of 98.0%. Similarly, the statistical analysis conducted on geographies consisting of 461,244,590 people shows a substantial positive correlation between the proportion of Eastern Europeans and percentage of population with at least 2nd grade education in the United States with a correlation coefficient (R) of 0.565 and weighted average of 98.4%, a difference of 0.38%.
2nd Grade Correlation Summary
| Measurement | Immigrants from Europe | Eastern European |
| Minimum | 83.1% | 97.7% |
| Maximum | 100.0% | 100.0% |
| Range | 16.9% | 2.3% |
| Mean | 98.3% | 99.5% |
| Median | 98.4% | 99.7% |
| Interquartile 25% (IQ1) | 97.5% | 99.0% |
| Interquartile 75% (IQ3) | 100.0% | 100.0% |
| Interquartile Range (IQR) | 2.5% | 1.0% |
| Standard Deviation (Sample) | 2.3% | 0.63% |
| Standard Deviation (Population) | 2.3% | 0.63% |
Similar Demographics by 2nd Grade
Demographics Similar to Immigrants from Europe by 2nd Grade
In terms of 2nd grade, the demographic groups most similar to Immigrants from Europe are Seminole (98.0%, a difference of 0.0%), Spaniard (98.0%, a difference of 0.0%), Cambodian (98.0%, a difference of 0.0%), Immigrants from Serbia (98.1%, a difference of 0.010%), and Immigrants from Croatia (98.1%, a difference of 0.010%).
| Demographics | Rating | Rank | 2nd Grade |
| Menominee | 94.1 /100 | #124 | Exceptional 98.1% |
| Iroquois | 94.1 /100 | #125 | Exceptional 98.1% |
| Syrians | 94.0 /100 | #126 | Exceptional 98.1% |
| Immigrants | Saudi Arabia | 93.6 /100 | #127 | Exceptional 98.1% |
| Immigrants | Serbia | 92.3 /100 | #128 | Exceptional 98.1% |
| Immigrants | Croatia | 92.1 /100 | #129 | Exceptional 98.1% |
| Seminole | 91.1 /100 | #130 | Exceptional 98.0% |
| Immigrants | Europe | 91.1 /100 | #131 | Exceptional 98.0% |
| Spaniards | 90.7 /100 | #132 | Exceptional 98.0% |
| Cambodians | 90.7 /100 | #133 | Exceptional 98.0% |
| Immigrants | Hungary | 89.7 /100 | #134 | Excellent 98.0% |
| Immigrants | Bulgaria | 89.7 /100 | #135 | Excellent 98.0% |
| Immigrants | Kuwait | 89.2 /100 | #136 | Excellent 98.0% |
| Immigrants | Romania | 88.3 /100 | #137 | Excellent 98.0% |
| Israelis | 87.9 /100 | #138 | Excellent 98.0% |
Demographics Similar to Eastern Europeans by 2nd Grade
In terms of 2nd grade, the demographic groups most similar to Eastern Europeans are Latvian (98.4%, a difference of 0.010%), Chippewa (98.4%, a difference of 0.010%), Luxembourger (98.4%, a difference of 0.010%), Native Hawaiian (98.4%, a difference of 0.010%), and Belgian (98.4%, a difference of 0.010%).
| Demographics | Rating | Rank | 2nd Grade |
| Chinese | 100.0 /100 | #34 | Exceptional 98.5% |
| Swiss | 100.0 /100 | #35 | Exceptional 98.5% |
| British | 100.0 /100 | #36 | Exceptional 98.5% |
| Italians | 99.9 /100 | #37 | Exceptional 98.4% |
| Latvians | 99.9 /100 | #38 | Exceptional 98.4% |
| Chippewa | 99.9 /100 | #39 | Exceptional 98.4% |
| Luxembourgers | 99.9 /100 | #40 | Exceptional 98.4% |
| Eastern Europeans | 99.9 /100 | #41 | Exceptional 98.4% |
| Native Hawaiians | 99.9 /100 | #42 | Exceptional 98.4% |
| Belgians | 99.9 /100 | #43 | Exceptional 98.4% |
| Northern Europeans | 99.9 /100 | #44 | Exceptional 98.4% |
| Hungarians | 99.9 /100 | #45 | Exceptional 98.4% |
| Lumbee | 99.9 /100 | #46 | Exceptional 98.4% |
| Ottawa | 99.9 /100 | #47 | Exceptional 98.4% |
| Czechoslovakians | 99.9 /100 | #48 | Exceptional 98.4% |