Immigrants from Ethiopia vs Barbadian Doctorate Degree
COMPARE
Immigrants from Ethiopia
Barbadian
Doctorate Degree
Doctorate Degree Comparison
Immigrants from Ethiopia
Barbadians
2.4%
DOCTORATE DEGREE
100.0/ 100
METRIC RATING
57th/ 347
METRIC RANK
1.6%
DOCTORATE DEGREE
3.3/ 100
METRIC RATING
233rd/ 347
METRIC RANK
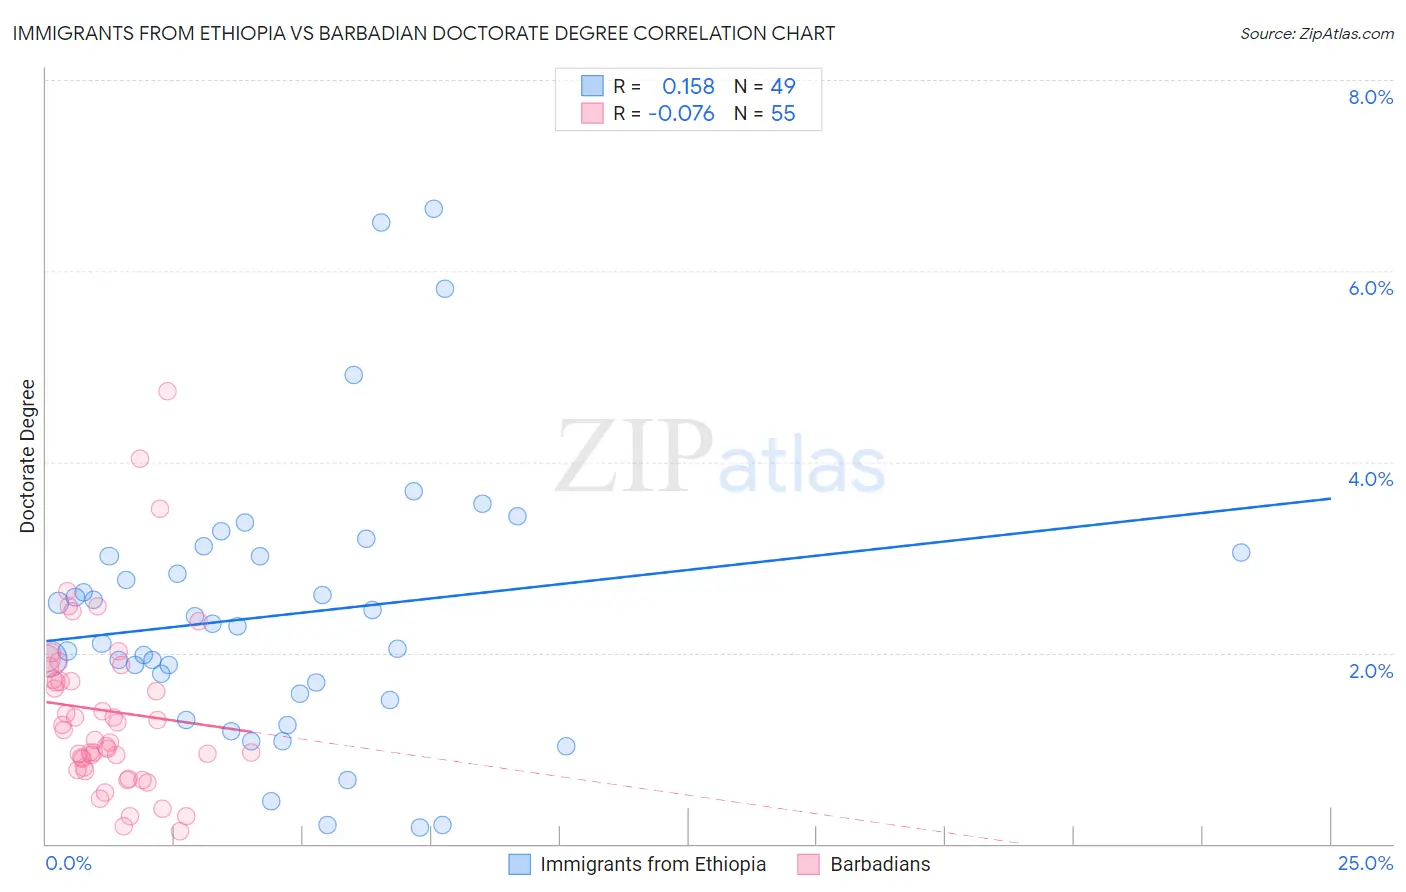
Immigrants from Ethiopia vs Barbadian Doctorate Degree Correlation Chart
The statistical analysis conducted on geographies consisting of 210,993,221 people shows a poor positive correlation between the proportion of Immigrants from Ethiopia and percentage of population with at least doctorate degree education in the United States with a correlation coefficient (R) of 0.158 and weighted average of 2.4%. Similarly, the statistical analysis conducted on geographies consisting of 140,930,059 people shows a slight negative correlation between the proportion of Barbadians and percentage of population with at least doctorate degree education in the United States with a correlation coefficient (R) of -0.076 and weighted average of 1.6%, a difference of 46.1%.
Doctorate Degree Correlation Summary
| Measurement | Immigrants from Ethiopia | Barbadian |
| Minimum | 0.18% | 0.13% |
| Maximum | 6.7% | 4.7% |
| Range | 6.5% | 4.6% |
| Mean | 2.4% | 1.4% |
| Median | 2.3% | 1.2% |
| Interquartile 25% (IQ1) | 1.5% | 0.80% |
| Interquartile 75% (IQ3) | 3.0% | 1.8% |
| Interquartile Range (IQR) | 1.5% | 1.1% |
| Standard Deviation (Sample) | 1.4% | 0.91% |
| Standard Deviation (Population) | 1.4% | 0.90% |
Similar Demographics by Doctorate Degree
Demographics Similar to Immigrants from Ethiopia by Doctorate Degree
In terms of doctorate degree, the demographic groups most similar to Immigrants from Ethiopia are Ethiopian (2.3%, a difference of 0.12%), Immigrants from Czechoslovakia (2.4%, a difference of 0.44%), Bolivian (2.4%, a difference of 0.53%), South African (2.3%, a difference of 0.56%), and Immigrants from Serbia (2.3%, a difference of 0.58%).
| Demographics | Rating | Rank | Doctorate Degree |
| Immigrants | Norway | 100.0 /100 | #50 | Exceptional 2.4% |
| Australians | 100.0 /100 | #51 | Exceptional 2.4% |
| Bulgarians | 100.0 /100 | #52 | Exceptional 2.4% |
| Immigrants | Latvia | 100.0 /100 | #53 | Exceptional 2.4% |
| Immigrants | Indonesia | 100.0 /100 | #54 | Exceptional 2.4% |
| Bolivians | 100.0 /100 | #55 | Exceptional 2.4% |
| Immigrants | Czechoslovakia | 100.0 /100 | #56 | Exceptional 2.4% |
| Immigrants | Ethiopia | 100.0 /100 | #57 | Exceptional 2.4% |
| Ethiopians | 99.9 /100 | #58 | Exceptional 2.3% |
| South Africans | 99.9 /100 | #59 | Exceptional 2.3% |
| Immigrants | Serbia | 99.9 /100 | #60 | Exceptional 2.3% |
| Bhutanese | 99.9 /100 | #61 | Exceptional 2.3% |
| Immigrants | Europe | 99.9 /100 | #62 | Exceptional 2.3% |
| Laotians | 99.9 /100 | #63 | Exceptional 2.3% |
| Immigrants | Greece | 99.9 /100 | #64 | Exceptional 2.3% |
Demographics Similar to Barbadians by Doctorate Degree
In terms of doctorate degree, the demographic groups most similar to Barbadians are Guamanian/Chamorro (1.6%, a difference of 0.070%), Hopi (1.6%, a difference of 0.15%), Cree (1.6%, a difference of 0.36%), Indonesian (1.6%, a difference of 0.64%), and Immigrants from North Macedonia (1.6%, a difference of 0.76%).
| Demographics | Rating | Rank | Doctorate Degree |
| Osage | 6.5 /100 | #226 | Tragic 1.7% |
| Panamanians | 6.3 /100 | #227 | Tragic 1.7% |
| Assyrians/Chaldeans/Syriacs | 5.9 /100 | #228 | Tragic 1.7% |
| Colville | 4.7 /100 | #229 | Tragic 1.6% |
| Immigrants | Philippines | 4.3 /100 | #230 | Tragic 1.6% |
| Immigrants | North Macedonia | 3.9 /100 | #231 | Tragic 1.6% |
| Guamanians/Chamorros | 3.3 /100 | #232 | Tragic 1.6% |
| Barbadians | 3.3 /100 | #233 | Tragic 1.6% |
| Hopi | 3.2 /100 | #234 | Tragic 1.6% |
| Cree | 3.0 /100 | #235 | Tragic 1.6% |
| Indonesians | 2.8 /100 | #236 | Tragic 1.6% |
| Iroquois | 2.7 /100 | #237 | Tragic 1.6% |
| Immigrants | Congo | 2.6 /100 | #238 | Tragic 1.6% |
| West Indians | 2.5 /100 | #239 | Tragic 1.6% |
| Immigrants | Panama | 2.4 /100 | #240 | Tragic 1.6% |