Immigrants from England vs Tongan Kindergarten
COMPARE
Immigrants from England
Tongan
Kindergarten
Kindergarten Comparison
Immigrants from England
Tongans
98.3%
KINDERGARTEN
99.3/ 100
METRIC RATING
76th/ 347
METRIC RANK
97.7%
KINDERGARTEN
4.8/ 100
METRIC RATING
220th/ 347
METRIC RANK
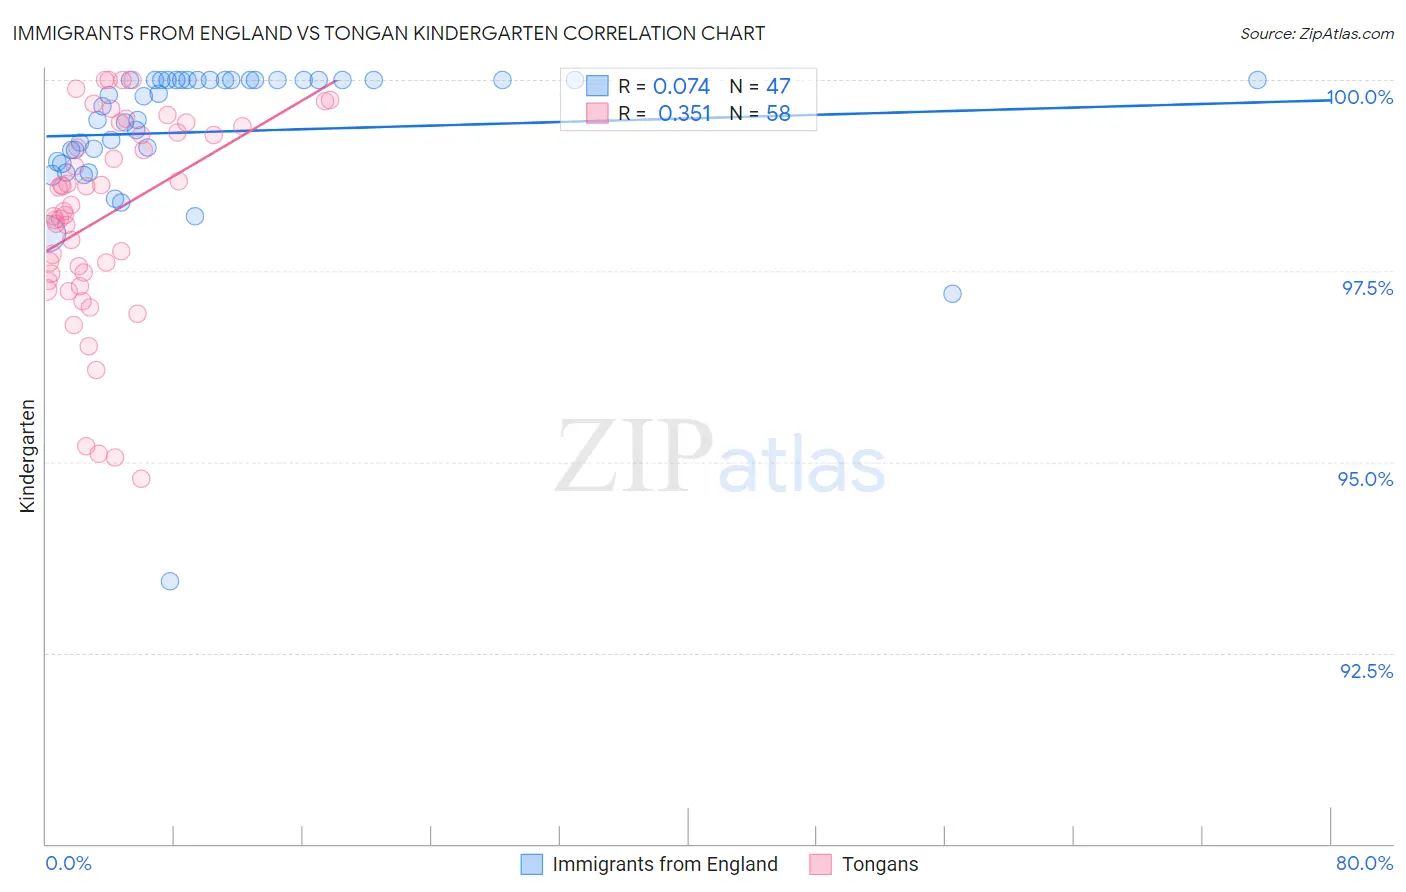
Immigrants from England vs Tongan Kindergarten Correlation Chart
The statistical analysis conducted on geographies consisting of 391,898,018 people shows a slight positive correlation between the proportion of Immigrants from England and percentage of population with at least kindergarten education in the United States with a correlation coefficient (R) of 0.074 and weighted average of 98.3%. Similarly, the statistical analysis conducted on geographies consisting of 102,908,759 people shows a mild positive correlation between the proportion of Tongans and percentage of population with at least kindergarten education in the United States with a correlation coefficient (R) of 0.351 and weighted average of 97.7%, a difference of 0.61%.
Kindergarten Correlation Summary
| Measurement | Immigrants from England | Tongan |
| Minimum | 93.4% | 94.8% |
| Maximum | 100.0% | 100.0% |
| Range | 6.6% | 5.2% |
| Mean | 99.3% | 98.2% |
| Median | 99.8% | 98.3% |
| Interquartile 25% (IQ1) | 98.9% | 97.5% |
| Interquartile 75% (IQ3) | 100.0% | 99.3% |
| Interquartile Range (IQR) | 1.1% | 1.8% |
| Standard Deviation (Sample) | 1.1% | 1.3% |
| Standard Deviation (Population) | 1.1% | 1.3% |
Similar Demographics by Kindergarten
Demographics Similar to Immigrants from England by Kindergarten
In terms of kindergarten, the demographic groups most similar to Immigrants from England are Cherokee (98.3%, a difference of 0.0%), Delaware (98.3%, a difference of 0.0%), Shoshone (98.3%, a difference of 0.0%), Cajun (98.3%, a difference of 0.010%), and Immigrants from Netherlands (98.3%, a difference of 0.010%).
| Demographics | Rating | Rank | Kindergarten |
| Immigrants | Austria | 99.6 /100 | #69 | Exceptional 98.4% |
| Russians | 99.6 /100 | #70 | Exceptional 98.4% |
| Chickasaw | 99.6 /100 | #71 | Exceptional 98.4% |
| Serbians | 99.6 /100 | #72 | Exceptional 98.4% |
| Cajuns | 99.4 /100 | #73 | Exceptional 98.3% |
| Immigrants | Netherlands | 99.3 /100 | #74 | Exceptional 98.3% |
| Cherokee | 99.3 /100 | #75 | Exceptional 98.3% |
| Immigrants | England | 99.3 /100 | #76 | Exceptional 98.3% |
| Delaware | 99.3 /100 | #77 | Exceptional 98.3% |
| Shoshone | 99.2 /100 | #78 | Exceptional 98.3% |
| Immigrants | Belgium | 99.2 /100 | #79 | Exceptional 98.3% |
| Immigrants | Lithuania | 99.2 /100 | #80 | Exceptional 98.3% |
| Icelanders | 99.2 /100 | #81 | Exceptional 98.3% |
| Potawatomi | 99.2 /100 | #82 | Exceptional 98.3% |
| Osage | 99.1 /100 | #83 | Exceptional 98.3% |
Demographics Similar to Tongans by Kindergarten
In terms of kindergarten, the demographic groups most similar to Tongans are Immigrants from Panama (97.7%, a difference of 0.0%), Immigrants from Zaire (97.7%, a difference of 0.0%), Immigrants from Sudan (97.7%, a difference of 0.0%), Immigrants from Morocco (97.7%, a difference of 0.010%), and Immigrants from Syria (97.7%, a difference of 0.010%).
| Demographics | Rating | Rank | Kindergarten |
| South American Indians | 7.7 /100 | #213 | Tragic 97.8% |
| Uruguayans | 7.5 /100 | #214 | Tragic 97.8% |
| Immigrants | Bahamas | 7.4 /100 | #215 | Tragic 97.8% |
| Samoans | 6.9 /100 | #216 | Tragic 97.8% |
| Bahamians | 6.6 /100 | #217 | Tragic 97.8% |
| Immigrants | Morocco | 5.4 /100 | #218 | Tragic 97.7% |
| Immigrants | Panama | 5.0 /100 | #219 | Tragic 97.7% |
| Tongans | 4.8 /100 | #220 | Tragic 97.7% |
| Immigrants | Zaire | 4.5 /100 | #221 | Tragic 97.7% |
| Immigrants | Sudan | 4.5 /100 | #222 | Tragic 97.7% |
| Immigrants | Syria | 4.3 /100 | #223 | Tragic 97.7% |
| Iraqis | 3.9 /100 | #224 | Tragic 97.7% |
| Immigrants | Nepal | 3.8 /100 | #225 | Tragic 97.7% |
| Sudanese | 3.7 /100 | #226 | Tragic 97.7% |
| Immigrants | Costa Rica | 3.6 /100 | #227 | Tragic 97.7% |