Immigrants from England vs French Canadian 3rd Grade
COMPARE
Immigrants from England
French Canadian
3rd Grade
3rd Grade Comparison
Immigrants from England
French Canadians
98.2%
3RD GRADE
99.2/ 100
METRIC RATING
76th/ 347
METRIC RANK
98.4%
3RD GRADE
100.0/ 100
METRIC RATING
29th/ 347
METRIC RANK
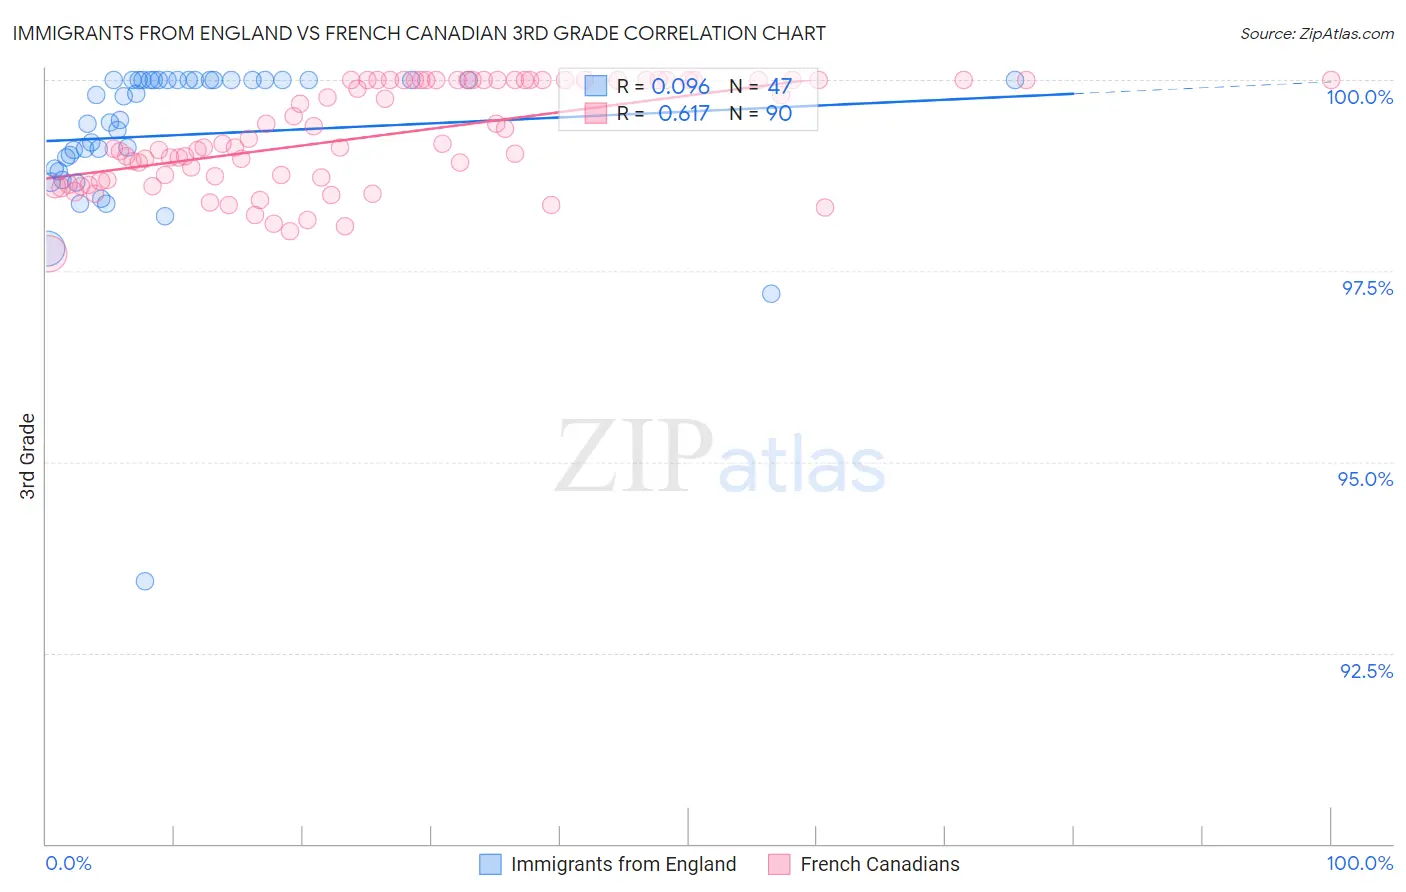
Immigrants from England vs French Canadian 3rd Grade Correlation Chart
The statistical analysis conducted on geographies consisting of 391,898,018 people shows a slight positive correlation between the proportion of Immigrants from England and percentage of population with at least 3rd grade education in the United States with a correlation coefficient (R) of 0.096 and weighted average of 98.2%. Similarly, the statistical analysis conducted on geographies consisting of 502,680,064 people shows a significant positive correlation between the proportion of French Canadians and percentage of population with at least 3rd grade education in the United States with a correlation coefficient (R) of 0.617 and weighted average of 98.4%, a difference of 0.28%.
3rd Grade Correlation Summary
| Measurement | Immigrants from England | French Canadian |
| Minimum | 93.4% | 97.7% |
| Maximum | 100.0% | 100.0% |
| Range | 6.6% | 2.3% |
| Mean | 99.3% | 99.3% |
| Median | 99.8% | 99.1% |
| Interquartile 25% (IQ1) | 98.8% | 98.7% |
| Interquartile 75% (IQ3) | 100.0% | 100.0% |
| Interquartile Range (IQR) | 1.2% | 1.3% |
| Standard Deviation (Sample) | 1.1% | 0.67% |
| Standard Deviation (Population) | 1.1% | 0.66% |
Similar Demographics by 3rd Grade
Demographics Similar to Immigrants from England by 3rd Grade
In terms of 3rd grade, the demographic groups most similar to Immigrants from England are Immigrants from Netherlands (98.2%, a difference of 0.0%), Cherokee (98.2%, a difference of 0.0%), Immigrants from Lithuania (98.2%, a difference of 0.0%), Cheyenne (98.2%, a difference of 0.010%), and Osage (98.2%, a difference of 0.010%).
| Demographics | Rating | Rank | 3rd Grade |
| Canadians | 99.6 /100 | #69 | Exceptional 98.2% |
| Cajuns | 99.6 /100 | #70 | Exceptional 98.2% |
| Immigrants | Austria | 99.6 /100 | #71 | Exceptional 98.2% |
| Chickasaw | 99.5 /100 | #72 | Exceptional 98.2% |
| Cheyenne | 99.3 /100 | #73 | Exceptional 98.2% |
| Immigrants | Netherlands | 99.3 /100 | #74 | Exceptional 98.2% |
| Cherokee | 99.3 /100 | #75 | Exceptional 98.2% |
| Immigrants | England | 99.2 /100 | #76 | Exceptional 98.2% |
| Immigrants | Lithuania | 99.2 /100 | #77 | Exceptional 98.2% |
| Osage | 99.2 /100 | #78 | Exceptional 98.2% |
| Immigrants | Belgium | 99.1 /100 | #79 | Exceptional 98.1% |
| Macedonians | 99.1 /100 | #80 | Exceptional 98.1% |
| Icelanders | 99.1 /100 | #81 | Exceptional 98.1% |
| Shoshone | 99.0 /100 | #82 | Exceptional 98.1% |
| Ukrainians | 98.9 /100 | #83 | Exceptional 98.1% |
Demographics Similar to French Canadians by 3rd Grade
In terms of 3rd grade, the demographic groups most similar to French Canadians are European (98.4%, a difference of 0.0%), French (98.4%, a difference of 0.010%), Czech (98.4%, a difference of 0.010%), Scandinavian (98.4%, a difference of 0.010%), and Croatian (98.5%, a difference of 0.020%).
| Demographics | Rating | Rank | 3rd Grade |
| Finns | 100.0 /100 | #22 | Exceptional 98.5% |
| Sioux | 100.0 /100 | #23 | Exceptional 98.5% |
| Danes | 100.0 /100 | #24 | Exceptional 98.5% |
| Scotch-Irish | 100.0 /100 | #25 | Exceptional 98.5% |
| Aleuts | 100.0 /100 | #26 | Exceptional 98.5% |
| Croatians | 100.0 /100 | #27 | Exceptional 98.5% |
| French | 100.0 /100 | #28 | Exceptional 98.4% |
| French Canadians | 100.0 /100 | #29 | Exceptional 98.4% |
| Europeans | 100.0 /100 | #30 | Exceptional 98.4% |
| Czechs | 100.0 /100 | #31 | Exceptional 98.4% |
| Scandinavians | 100.0 /100 | #32 | Exceptional 98.4% |
| Chinese | 100.0 /100 | #33 | Exceptional 98.4% |
| Swiss | 100.0 /100 | #34 | Exceptional 98.4% |
| Arapaho | 100.0 /100 | #35 | Exceptional 98.4% |
| British | 99.9 /100 | #36 | Exceptional 98.4% |