Immigrants from England vs Finnish 12th Grade, No Diploma
COMPARE
Immigrants from England
Finnish
12th Grade, No Diploma
12th Grade, No Diploma Comparison
Immigrants from England
Finns
92.6%
12TH GRADE, NO DIPLOMA
99.4/ 100
METRIC RATING
77th/ 347
METRIC RANK
93.4%
12TH GRADE, NO DIPLOMA
100.0/ 100
METRIC RATING
15th/ 347
METRIC RANK
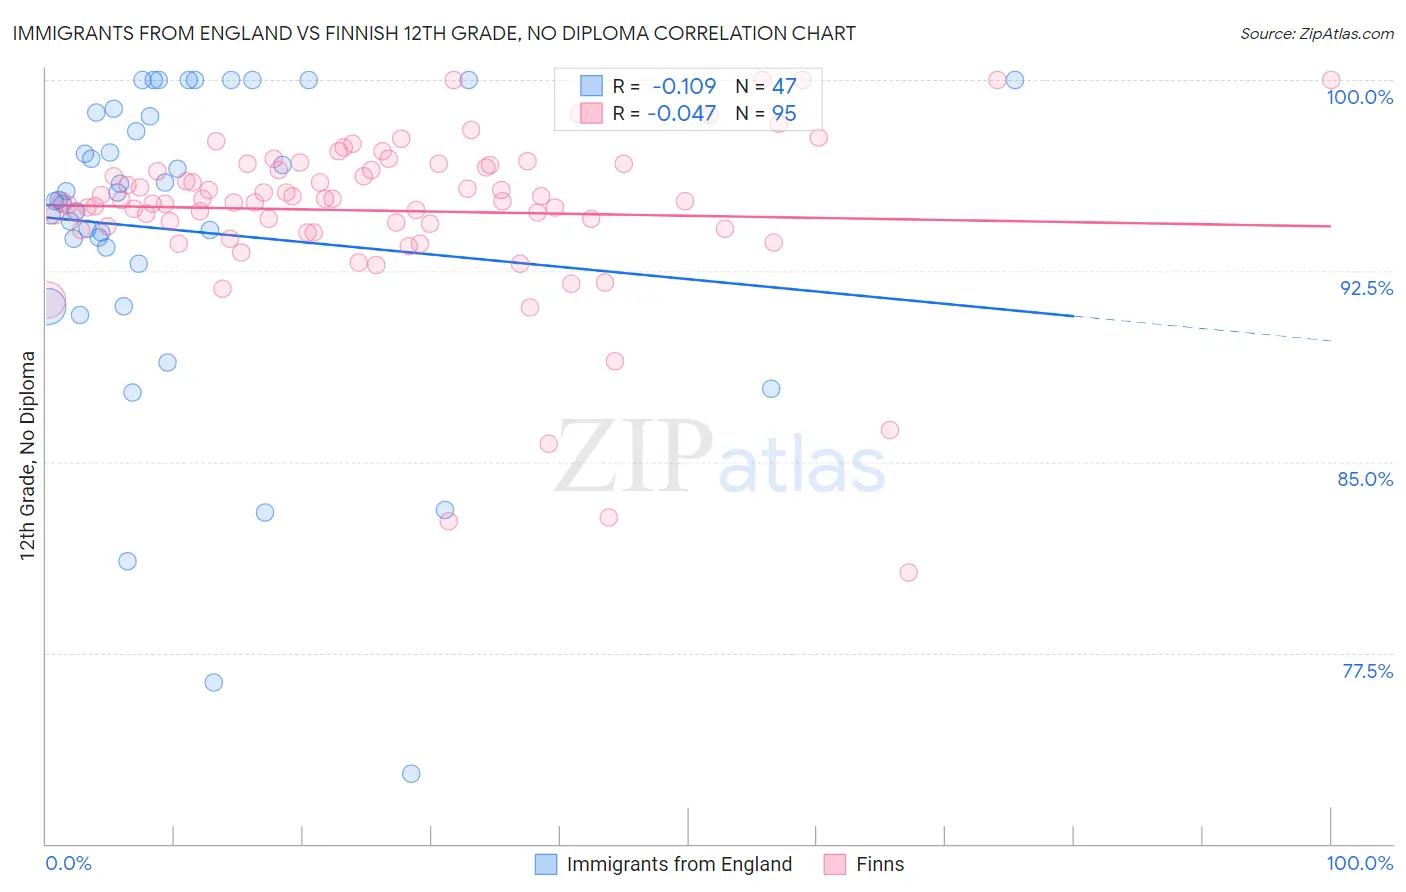
Immigrants from England vs Finnish 12th Grade, No Diploma Correlation Chart
The statistical analysis conducted on geographies consisting of 391,897,700 people shows a poor negative correlation between the proportion of Immigrants from England and percentage of population with at least 12th grade (no diploma) education in the United States with a correlation coefficient (R) of -0.109 and weighted average of 92.6%. Similarly, the statistical analysis conducted on geographies consisting of 404,676,167 people shows no correlation between the proportion of Finns and percentage of population with at least 12th grade (no diploma) education in the United States with a correlation coefficient (R) of -0.047 and weighted average of 93.4%, a difference of 0.83%.
12th Grade, No Diploma Correlation Summary
| Measurement | Immigrants from England | Finnish |
| Minimum | 72.7% | 80.6% |
| Maximum | 100.0% | 100.0% |
| Range | 27.3% | 19.4% |
| Mean | 94.1% | 94.9% |
| Median | 95.3% | 95.3% |
| Interquartile 25% (IQ1) | 92.8% | 94.1% |
| Interquartile 75% (IQ3) | 98.7% | 96.7% |
| Interquartile Range (IQR) | 5.9% | 2.5% |
| Standard Deviation (Sample) | 6.3% | 3.3% |
| Standard Deviation (Population) | 6.2% | 3.3% |
Similar Demographics by 12th Grade, No Diploma
Demographics Similar to Immigrants from England by 12th Grade, No Diploma
In terms of 12th grade, no diploma, the demographic groups most similar to Immigrants from England are Burmese (92.6%, a difference of 0.020%), Immigrants from Moldova (92.6%, a difference of 0.020%), Native Hawaiian (92.6%, a difference of 0.020%), French (92.6%, a difference of 0.020%), and Immigrants from South Central Asia (92.6%, a difference of 0.030%).
| Demographics | Rating | Rank | 12th Grade, No Diploma |
| Czechoslovakians | 99.5 /100 | #70 | Exceptional 92.6% |
| Immigrants | Latvia | 99.5 /100 | #71 | Exceptional 92.6% |
| Immigrants | South Central Asia | 99.5 /100 | #72 | Exceptional 92.6% |
| Burmese | 99.4 /100 | #73 | Exceptional 92.6% |
| Immigrants | Moldova | 99.4 /100 | #74 | Exceptional 92.6% |
| Native Hawaiians | 99.4 /100 | #75 | Exceptional 92.6% |
| French | 99.4 /100 | #76 | Exceptional 92.6% |
| Immigrants | England | 99.4 /100 | #77 | Exceptional 92.6% |
| Cambodians | 99.3 /100 | #78 | Exceptional 92.6% |
| Romanians | 99.3 /100 | #79 | Exceptional 92.6% |
| French Canadians | 99.3 /100 | #80 | Exceptional 92.6% |
| Immigrants | Denmark | 99.2 /100 | #81 | Exceptional 92.5% |
| Immigrants | Switzerland | 99.2 /100 | #82 | Exceptional 92.5% |
| Immigrants | Israel | 99.2 /100 | #83 | Exceptional 92.5% |
| Immigrants | Bulgaria | 99.1 /100 | #84 | Exceptional 92.5% |
Demographics Similar to Finns by 12th Grade, No Diploma
In terms of 12th grade, no diploma, the demographic groups most similar to Finns are Maltese (93.3%, a difference of 0.040%), Luxembourger (93.3%, a difference of 0.060%), Bulgarian (93.5%, a difference of 0.090%), Immigrants from Singapore (93.3%, a difference of 0.090%), and Danish (93.5%, a difference of 0.11%).
| Demographics | Rating | Rank | 12th Grade, No Diploma |
| Chinese | 100.0 /100 | #8 | Exceptional 93.6% |
| Latvians | 100.0 /100 | #9 | Exceptional 93.6% |
| Croatians | 100.0 /100 | #10 | Exceptional 93.5% |
| Poles | 100.0 /100 | #11 | Exceptional 93.5% |
| Eastern Europeans | 100.0 /100 | #12 | Exceptional 93.5% |
| Danes | 100.0 /100 | #13 | Exceptional 93.5% |
| Bulgarians | 100.0 /100 | #14 | Exceptional 93.5% |
| Finns | 100.0 /100 | #15 | Exceptional 93.4% |
| Maltese | 100.0 /100 | #16 | Exceptional 93.3% |
| Luxembourgers | 100.0 /100 | #17 | Exceptional 93.3% |
| Immigrants | Singapore | 99.9 /100 | #18 | Exceptional 93.3% |
| Germans | 99.9 /100 | #19 | Exceptional 93.3% |
| Filipinos | 99.9 /100 | #20 | Exceptional 93.2% |
| Italians | 99.9 /100 | #21 | Exceptional 93.2% |
| Estonians | 99.9 /100 | #22 | Exceptional 93.2% |