Immigrants from England vs Crow 7th Grade
COMPARE
Immigrants from England
Crow
7th Grade
7th Grade Comparison
Immigrants from England
Crow
96.8%
7TH GRADE
99.5/ 100
METRIC RATING
74th/ 347
METRIC RANK
99.1%
7TH GRADE
100.0/ 100
METRIC RATING
1st/ 347
METRIC RANK
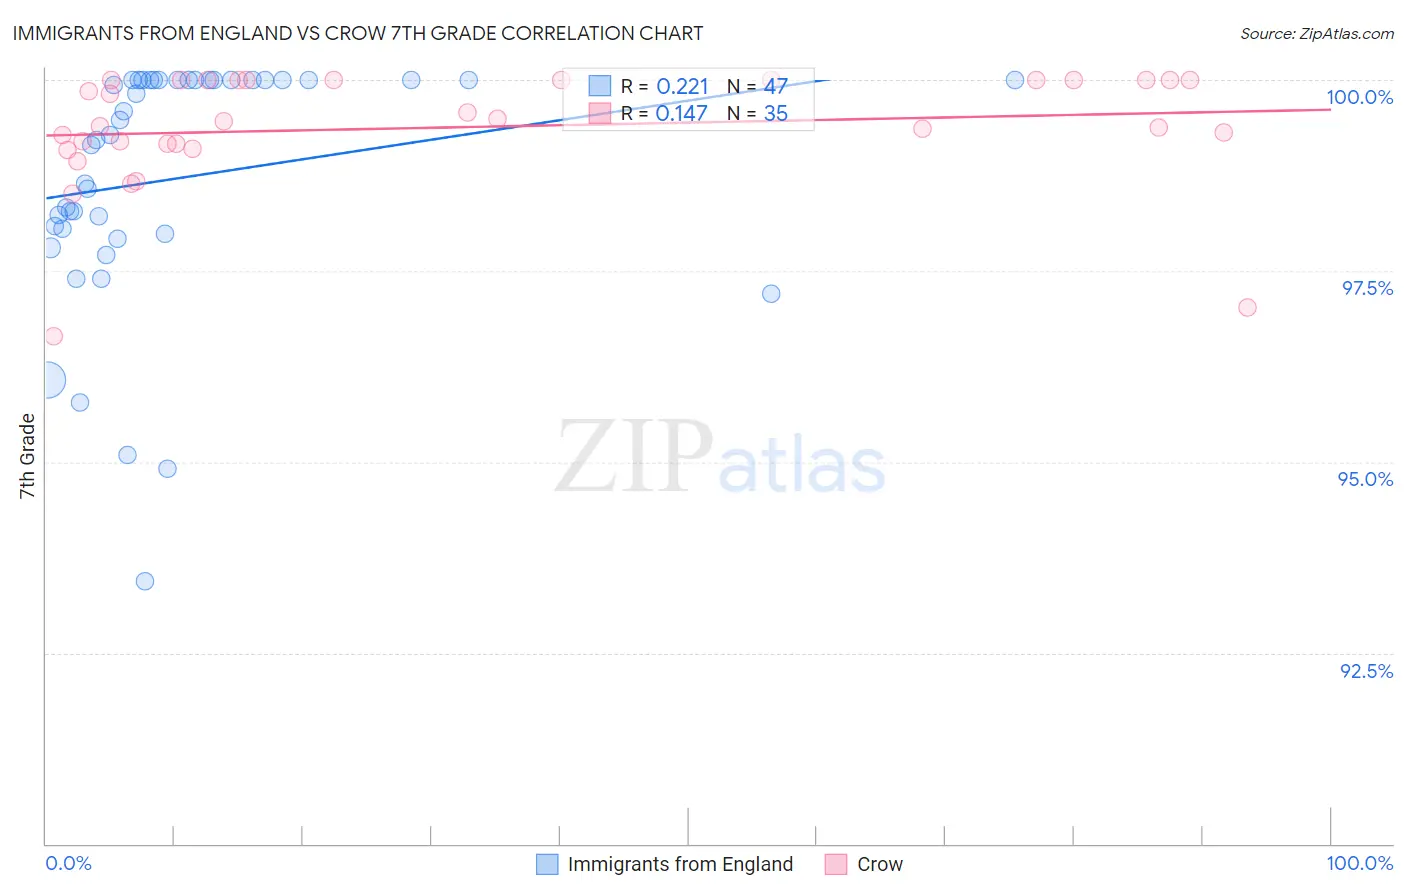
Immigrants from England vs Crow 7th Grade Correlation Chart
The statistical analysis conducted on geographies consisting of 391,898,018 people shows a weak positive correlation between the proportion of Immigrants from England and percentage of population with at least 7th grade education in the United States with a correlation coefficient (R) of 0.221 and weighted average of 96.8%. Similarly, the statistical analysis conducted on geographies consisting of 665,246 people shows a poor positive correlation between the proportion of Crow and percentage of population with at least 7th grade education in the United States with a correlation coefficient (R) of 0.147 and weighted average of 99.1%, a difference of 2.4%.
7th Grade Correlation Summary
| Measurement | Immigrants from England | Crow |
| Minimum | 93.4% | 96.7% |
| Maximum | 100.0% | 100.0% |
| Range | 6.6% | 3.3% |
| Mean | 98.7% | 99.4% |
| Median | 99.3% | 99.5% |
| Interquartile 25% (IQ1) | 98.0% | 99.2% |
| Interquartile 75% (IQ3) | 100.0% | 100.0% |
| Interquartile Range (IQR) | 2.0% | 0.84% |
| Standard Deviation (Sample) | 1.6% | 0.78% |
| Standard Deviation (Population) | 1.6% | 0.77% |
Similar Demographics by 7th Grade
Demographics Similar to Immigrants from England by 7th Grade
In terms of 7th grade, the demographic groups most similar to Immigrants from England are Zimbabwean (96.8%, a difference of 0.0%), Arapaho (96.8%, a difference of 0.010%), Immigrants from Lithuania (96.8%, a difference of 0.030%), Cajun (96.8%, a difference of 0.030%), and Immigrants from Ireland (96.8%, a difference of 0.030%).
| Demographics | Rating | Rank | 7th Grade |
| Native Hawaiians | 99.7 /100 | #67 | Exceptional 96.9% |
| Immigrants | India | 99.6 /100 | #68 | Exceptional 96.9% |
| Iranians | 99.6 /100 | #69 | Exceptional 96.8% |
| New Zealanders | 99.6 /100 | #70 | Exceptional 96.8% |
| Immigrants | Lithuania | 99.6 /100 | #71 | Exceptional 96.8% |
| Cajuns | 99.5 /100 | #72 | Exceptional 96.8% |
| Arapaho | 99.5 /100 | #73 | Exceptional 96.8% |
| Immigrants | England | 99.5 /100 | #74 | Exceptional 96.8% |
| Zimbabweans | 99.5 /100 | #75 | Exceptional 96.8% |
| Immigrants | Ireland | 99.4 /100 | #76 | Exceptional 96.8% |
| Cherokee | 99.4 /100 | #77 | Exceptional 96.8% |
| Immigrants | Netherlands | 99.3 /100 | #78 | Exceptional 96.8% |
| Cypriots | 99.3 /100 | #79 | Exceptional 96.8% |
| Yugoslavians | 99.3 /100 | #80 | Exceptional 96.8% |
| Delaware | 99.2 /100 | #81 | Exceptional 96.8% |
Demographics Similar to Crow by 7th Grade
In terms of 7th grade, the demographic groups most similar to Crow are Finnish (98.5%, a difference of 0.65%), Carpatho Rusyn (98.3%, a difference of 0.83%), Ottawa (98.1%, a difference of 1.0%), Dutch (97.9%, a difference of 1.3%), and Tsimshian (97.8%, a difference of 1.4%).
| Demographics | Rating | Rank | 7th Grade |
| Crow | 100.0 /100 | #1 | Exceptional 99.1% |
| Finns | 100.0 /100 | #2 | Exceptional 98.5% |
| Carpatho Rusyns | 100.0 /100 | #3 | Exceptional 98.3% |
| Ottawa | 100.0 /100 | #4 | Exceptional 98.1% |
| Dutch | 100.0 /100 | #5 | Exceptional 97.9% |
| Tsimshian | 100.0 /100 | #6 | Exceptional 97.8% |
| Norwegians | 100.0 /100 | #7 | Exceptional 97.8% |
| Slovaks | 100.0 /100 | #8 | Exceptional 97.8% |
| Germans | 100.0 /100 | #9 | Exceptional 97.7% |
| Slovenes | 100.0 /100 | #10 | Exceptional 97.6% |
| Alaskan Athabascans | 100.0 /100 | #11 | Exceptional 97.6% |
| Poles | 100.0 /100 | #12 | Exceptional 97.6% |
| Swedes | 100.0 /100 | #13 | Exceptional 97.6% |
| Pennsylvania Germans | 100.0 /100 | #14 | Exceptional 97.6% |
| English | 100.0 /100 | #15 | Exceptional 97.6% |