Immigrants from England vs Basque 6th Grade
COMPARE
Immigrants from England
Basque
6th Grade
6th Grade Comparison
Immigrants from England
Basques
97.6%
6TH GRADE
99.4/ 100
METRIC RATING
76th/ 347
METRIC RANK
97.4%
6TH GRADE
95.4/ 100
METRIC RATING
117th/ 347
METRIC RANK
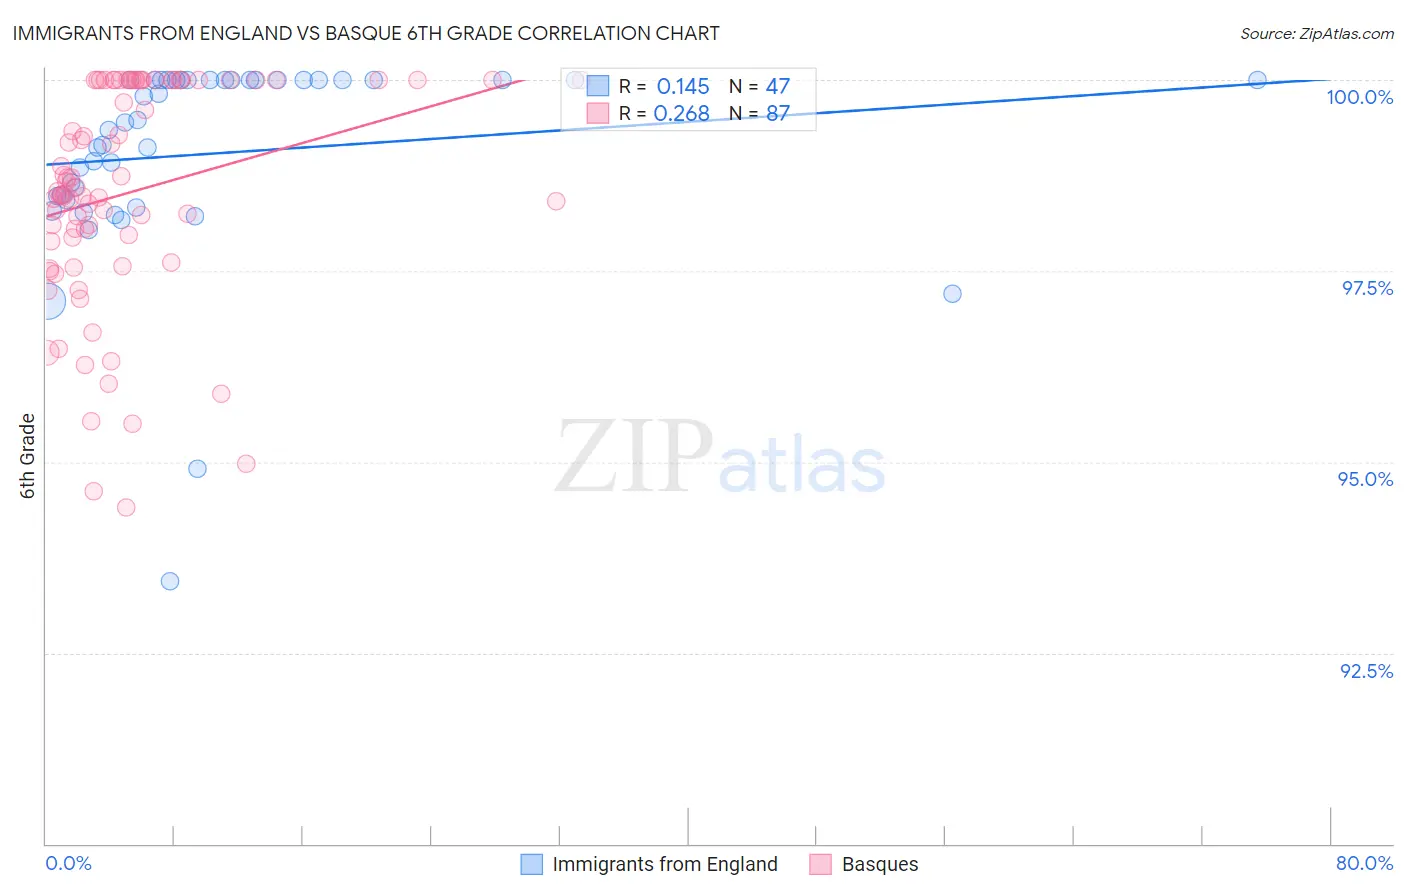
Immigrants from England vs Basque 6th Grade Correlation Chart
The statistical analysis conducted on geographies consisting of 391,898,018 people shows a poor positive correlation between the proportion of Immigrants from England and percentage of population with at least 6th grade education in the United States with a correlation coefficient (R) of 0.145 and weighted average of 97.6%. Similarly, the statistical analysis conducted on geographies consisting of 165,772,632 people shows a weak positive correlation between the proportion of Basques and percentage of population with at least 6th grade education in the United States with a correlation coefficient (R) of 0.268 and weighted average of 97.4%, a difference of 0.23%.
6th Grade Correlation Summary
| Measurement | Immigrants from England | Basque |
| Minimum | 93.4% | 94.4% |
| Maximum | 100.0% | 100.0% |
| Range | 6.6% | 5.6% |
| Mean | 99.0% | 98.5% |
| Median | 99.4% | 98.5% |
| Interquartile 25% (IQ1) | 98.4% | 97.9% |
| Interquartile 75% (IQ3) | 100.0% | 100.0% |
| Interquartile Range (IQR) | 1.6% | 2.1% |
| Standard Deviation (Sample) | 1.3% | 1.4% |
| Standard Deviation (Population) | 1.3% | 1.4% |
Similar Demographics by 6th Grade
Demographics Similar to Immigrants from England by 6th Grade
In terms of 6th grade, the demographic groups most similar to Immigrants from England are Ukrainian (97.6%, a difference of 0.0%), Macedonian (97.6%, a difference of 0.010%), Cherokee (97.6%, a difference of 0.010%), Immigrants from Netherlands (97.6%, a difference of 0.010%), and Immigrants from Lithuania (97.6%, a difference of 0.010%).
| Demographics | Rating | Rank | 6th Grade |
| Iranians | 99.6 /100 | #69 | Exceptional 97.6% |
| Cajuns | 99.5 /100 | #70 | Exceptional 97.6% |
| Chickasaw | 99.5 /100 | #71 | Exceptional 97.6% |
| Macedonians | 99.4 /100 | #72 | Exceptional 97.6% |
| Cherokee | 99.4 /100 | #73 | Exceptional 97.6% |
| Immigrants | Netherlands | 99.4 /100 | #74 | Exceptional 97.6% |
| Ukrainians | 99.4 /100 | #75 | Exceptional 97.6% |
| Immigrants | England | 99.4 /100 | #76 | Exceptional 97.6% |
| Immigrants | Lithuania | 99.3 /100 | #77 | Exceptional 97.6% |
| Icelanders | 99.3 /100 | #78 | Exceptional 97.6% |
| Immigrants | India | 99.3 /100 | #79 | Exceptional 97.6% |
| Osage | 99.3 /100 | #80 | Exceptional 97.6% |
| Lumbee | 99.2 /100 | #81 | Exceptional 97.6% |
| Zimbabweans | 99.1 /100 | #82 | Exceptional 97.6% |
| Potawatomi | 99.1 /100 | #83 | Exceptional 97.6% |
Demographics Similar to Basques by 6th Grade
In terms of 6th grade, the demographic groups most similar to Basques are Lebanese (97.4%, a difference of 0.0%), Immigrants from Japan (97.4%, a difference of 0.0%), Immigrants from Switzerland (97.4%, a difference of 0.010%), Immigrants from Zimbabwe (97.4%, a difference of 0.010%), and Syrian (97.4%, a difference of 0.010%).
| Demographics | Rating | Rank | 6th Grade |
| Thais | 96.9 /100 | #110 | Exceptional 97.4% |
| Iroquois | 96.9 /100 | #111 | Exceptional 97.4% |
| Immigrants | Latvia | 96.7 /100 | #112 | Exceptional 97.4% |
| Immigrants | Saudi Arabia | 96.5 /100 | #113 | Exceptional 97.4% |
| Colville | 96.4 /100 | #114 | Exceptional 97.4% |
| Immigrants | Switzerland | 95.7 /100 | #115 | Exceptional 97.4% |
| Lebanese | 95.5 /100 | #116 | Exceptional 97.4% |
| Basques | 95.4 /100 | #117 | Exceptional 97.4% |
| Immigrants | Japan | 95.2 /100 | #118 | Exceptional 97.4% |
| Immigrants | Zimbabwe | 95.0 /100 | #119 | Exceptional 97.4% |
| Syrians | 94.8 /100 | #120 | Exceptional 97.4% |
| Immigrants | Norway | 94.7 /100 | #121 | Exceptional 97.4% |
| Immigrants | France | 94.5 /100 | #122 | Exceptional 97.4% |
| Hmong | 94.4 /100 | #123 | Exceptional 97.4% |
| Okinawans | 94.2 /100 | #124 | Exceptional 97.4% |