Immigrants from Egypt vs Immigrants from Iraq Nursery School
COMPARE
Immigrants from Egypt
Immigrants from Iraq
Nursery School
Nursery School Comparison
Immigrants from Egypt
Immigrants from Iraq
97.9%
NURSERY SCHOOL
22.5/ 100
METRIC RATING
199th/ 347
METRIC RANK
97.6%
NURSERY SCHOOL
0.7/ 100
METRIC RATING
253rd/ 347
METRIC RANK
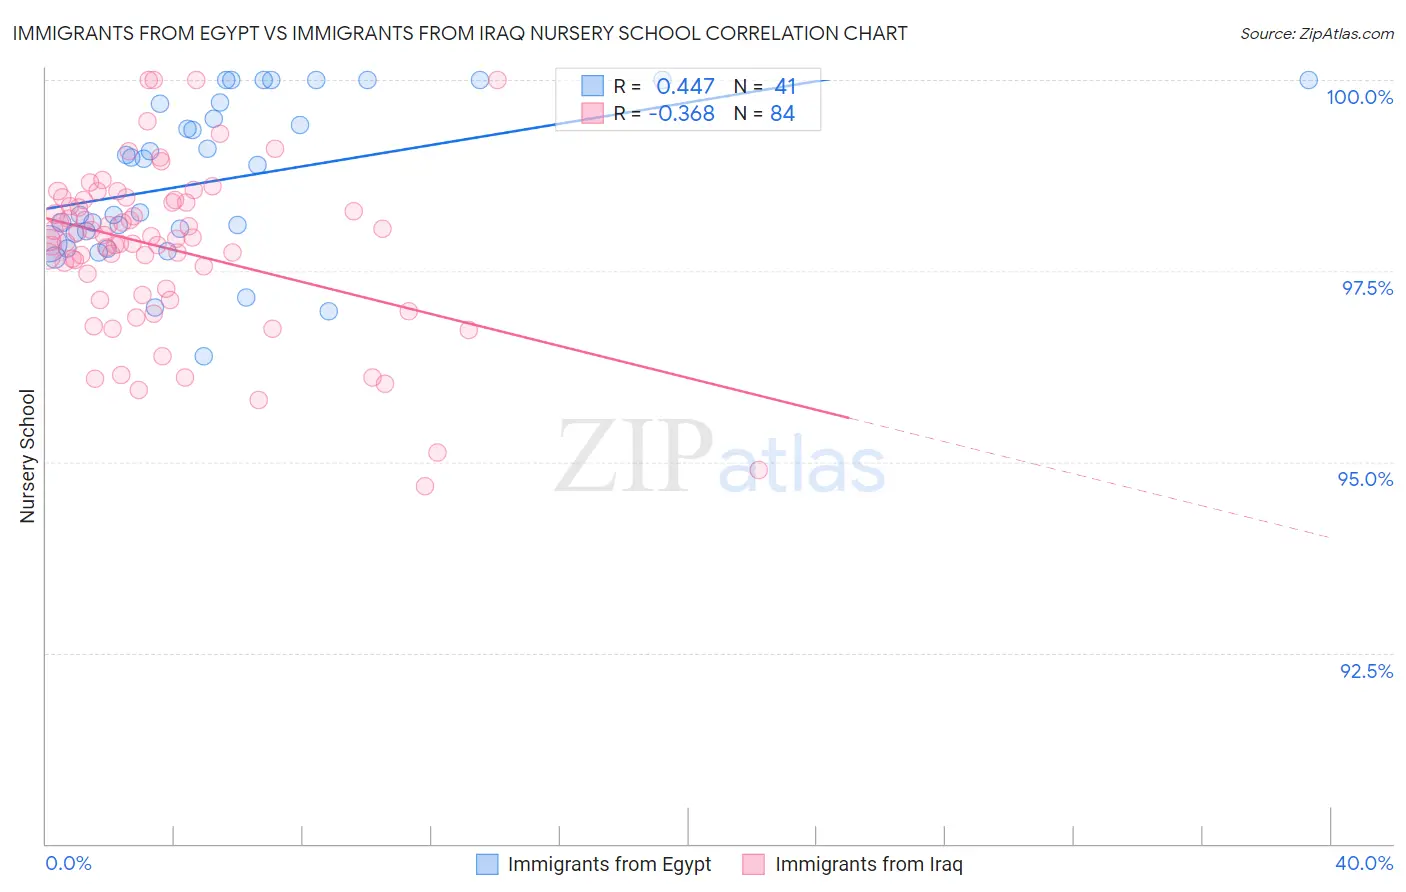
Immigrants from Egypt vs Immigrants from Iraq Nursery School Correlation Chart
The statistical analysis conducted on geographies consisting of 245,485,794 people shows a moderate positive correlation between the proportion of Immigrants from Egypt and percentage of population with at least nursery school education in the United States with a correlation coefficient (R) of 0.447 and weighted average of 97.9%. Similarly, the statistical analysis conducted on geographies consisting of 194,726,982 people shows a mild negative correlation between the proportion of Immigrants from Iraq and percentage of population with at least nursery school education in the United States with a correlation coefficient (R) of -0.368 and weighted average of 97.6%, a difference of 0.28%.
Nursery School Correlation Summary
| Measurement | Immigrants from Egypt | Immigrants from Iraq |
| Minimum | 96.4% | 94.7% |
| Maximum | 100.0% | 100.0% |
| Range | 3.6% | 5.3% |
| Mean | 98.7% | 97.8% |
| Median | 98.9% | 97.9% |
| Interquartile 25% (IQ1) | 97.9% | 97.2% |
| Interquartile 75% (IQ3) | 99.7% | 98.4% |
| Interquartile Range (IQR) | 1.8% | 1.2% |
| Standard Deviation (Sample) | 1.0% | 1.1% |
| Standard Deviation (Population) | 1.0% | 1.1% |
Similar Demographics by Nursery School
Demographics Similar to Immigrants from Egypt by Nursery School
In terms of nursery school, the demographic groups most similar to Immigrants from Egypt are Tohono O'odham (97.9%, a difference of 0.0%), Guamanian/Chamorro (97.9%, a difference of 0.010%), Yuman (97.9%, a difference of 0.010%), Immigrants from Kenya (97.9%, a difference of 0.010%), and Immigrants from Lebanon (97.9%, a difference of 0.010%).
| Demographics | Rating | Rank | Nursery School |
| Blacks/African Americans | 29.4 /100 | #192 | Fair 97.9% |
| Paraguayans | 27.4 /100 | #193 | Fair 97.9% |
| Mongolians | 27.3 /100 | #194 | Fair 97.9% |
| Hawaiians | 27.2 /100 | #195 | Fair 97.9% |
| Guamanians/Chamorros | 25.7 /100 | #196 | Fair 97.9% |
| Yuman | 25.7 /100 | #197 | Fair 97.9% |
| Immigrants | Kenya | 24.1 /100 | #198 | Fair 97.9% |
| Immigrants | Egypt | 22.5 /100 | #199 | Fair 97.9% |
| Tohono O'odham | 22.2 /100 | #200 | Fair 97.9% |
| Immigrants | Lebanon | 21.2 /100 | #201 | Fair 97.9% |
| Immigrants | Ukraine | 19.9 /100 | #202 | Poor 97.9% |
| Immigrants | Uganda | 18.0 /100 | #203 | Poor 97.9% |
| Immigrants | Southern Europe | 17.4 /100 | #204 | Poor 97.9% |
| Immigrants | Chile | 17.3 /100 | #205 | Poor 97.9% |
| Immigrants | Albania | 16.4 /100 | #206 | Poor 97.9% |
Demographics Similar to Immigrants from Iraq by Nursery School
In terms of nursery school, the demographic groups most similar to Immigrants from Iraq are Immigrants from Africa (97.6%, a difference of 0.0%), Immigrants from Congo (97.6%, a difference of 0.0%), Immigrants from Senegal (97.6%, a difference of 0.010%), Ethiopian (97.6%, a difference of 0.010%), and Immigrants from Asia (97.6%, a difference of 0.010%).
| Demographics | Rating | Rank | Nursery School |
| Peruvians | 1.0 /100 | #246 | Tragic 97.6% |
| Immigrants | Middle Africa | 0.9 /100 | #247 | Tragic 97.6% |
| Indians (Asian) | 0.9 /100 | #248 | Tragic 97.6% |
| Immigrants | Eastern Africa | 0.9 /100 | #249 | Tragic 97.6% |
| Immigrants | Senegal | 0.9 /100 | #250 | Tragic 97.6% |
| Ethiopians | 0.8 /100 | #251 | Tragic 97.6% |
| Immigrants | Africa | 0.8 /100 | #252 | Tragic 97.6% |
| Immigrants | Iraq | 0.7 /100 | #253 | Tragic 97.6% |
| Immigrants | Congo | 0.7 /100 | #254 | Tragic 97.6% |
| Immigrants | Asia | 0.7 /100 | #255 | Tragic 97.6% |
| Yaqui | 0.6 /100 | #256 | Tragic 97.6% |
| Immigrants | Colombia | 0.6 /100 | #257 | Tragic 97.6% |
| Jamaicans | 0.6 /100 | #258 | Tragic 97.6% |
| Armenians | 0.4 /100 | #259 | Tragic 97.6% |
| Immigrants | South America | 0.4 /100 | #260 | Tragic 97.6% |