Immigrants from Eastern Europe vs Potawatomi Kindergarten
COMPARE
Immigrants from Eastern Europe
Potawatomi
Kindergarten
Kindergarten Comparison
Immigrants from Eastern Europe
Potawatomi
98.0%
KINDERGARTEN
59.0/ 100
METRIC RATING
161st/ 347
METRIC RANK
98.3%
KINDERGARTEN
99.2/ 100
METRIC RATING
82nd/ 347
METRIC RANK
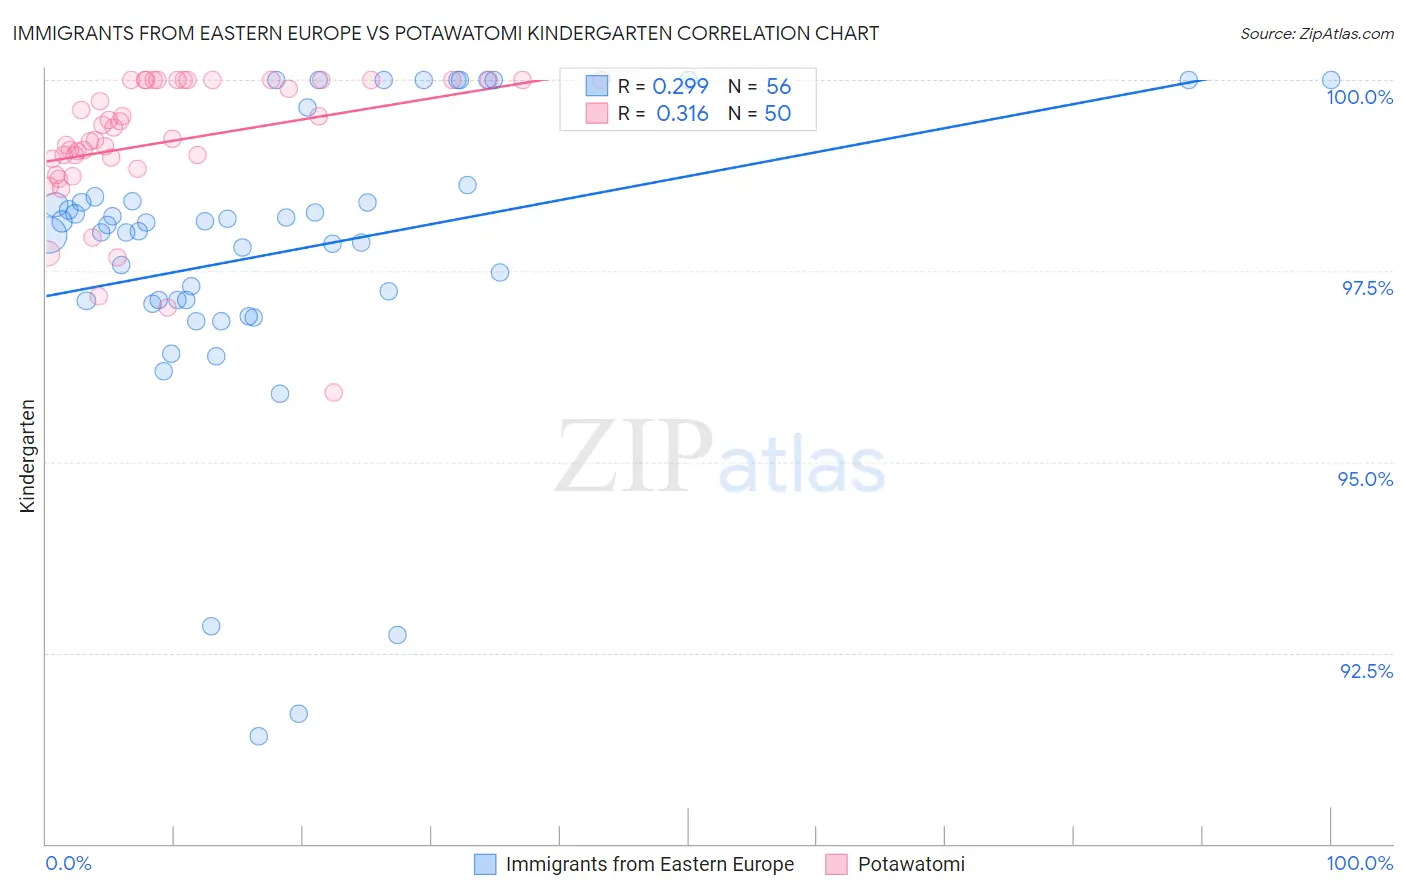
Immigrants from Eastern Europe vs Potawatomi Kindergarten Correlation Chart
The statistical analysis conducted on geographies consisting of 475,879,420 people shows a weak positive correlation between the proportion of Immigrants from Eastern Europe and percentage of population with at least kindergarten education in the United States with a correlation coefficient (R) of 0.299 and weighted average of 98.0%. Similarly, the statistical analysis conducted on geographies consisting of 117,769,196 people shows a mild positive correlation between the proportion of Potawatomi and percentage of population with at least kindergarten education in the United States with a correlation coefficient (R) of 0.316 and weighted average of 98.3%, a difference of 0.34%.
Kindergarten Correlation Summary
| Measurement | Immigrants from Eastern Europe | Potawatomi |
| Minimum | 91.4% | 95.9% |
| Maximum | 100.0% | 100.0% |
| Range | 8.6% | 4.1% |
| Mean | 97.7% | 99.2% |
| Median | 98.1% | 99.3% |
| Interquartile 25% (IQ1) | 97.1% | 99.0% |
| Interquartile 75% (IQ3) | 98.4% | 100.0% |
| Interquartile Range (IQR) | 1.3% | 1.0% |
| Standard Deviation (Sample) | 1.9% | 0.89% |
| Standard Deviation (Population) | 1.9% | 0.88% |
Similar Demographics by Kindergarten
Demographics Similar to Immigrants from Eastern Europe by Kindergarten
In terms of kindergarten, the demographic groups most similar to Immigrants from Eastern Europe are Immigrants from Russia (98.0%, a difference of 0.0%), Immigrants from Italy (98.0%, a difference of 0.0%), Spanish American (98.0%, a difference of 0.0%), Immigrants from Micronesia (98.0%, a difference of 0.0%), and Ugandan (98.0%, a difference of 0.010%).
| Demographics | Rating | Rank | Kindergarten |
| Immigrants | Iran | 68.8 /100 | #154 | Good 98.0% |
| Comanche | 68.3 /100 | #155 | Good 98.0% |
| Immigrants | South Central Asia | 66.6 /100 | #156 | Good 98.0% |
| Immigrants | North Macedonia | 66.4 /100 | #157 | Good 98.0% |
| Venezuelans | 64.7 /100 | #158 | Good 98.0% |
| French American Indians | 63.7 /100 | #159 | Good 98.0% |
| Immigrants | Russia | 59.0 /100 | #160 | Average 98.0% |
| Immigrants | Eastern Europe | 59.0 /100 | #161 | Average 98.0% |
| Immigrants | Italy | 58.9 /100 | #162 | Average 98.0% |
| Spanish Americans | 57.8 /100 | #163 | Average 98.0% |
| Immigrants | Micronesia | 57.7 /100 | #164 | Average 98.0% |
| Ugandans | 56.9 /100 | #165 | Average 98.0% |
| Chileans | 56.3 /100 | #166 | Average 98.0% |
| Immigrants | Spain | 54.6 /100 | #167 | Average 98.0% |
| Navajo | 54.4 /100 | #168 | Average 98.0% |
Demographics Similar to Potawatomi by Kindergarten
In terms of kindergarten, the demographic groups most similar to Potawatomi are Immigrants from Belgium (98.3%, a difference of 0.0%), Immigrants from Lithuania (98.3%, a difference of 0.0%), Icelander (98.3%, a difference of 0.0%), Osage (98.3%, a difference of 0.0%), and Cherokee (98.3%, a difference of 0.010%).
| Demographics | Rating | Rank | Kindergarten |
| Cherokee | 99.3 /100 | #75 | Exceptional 98.3% |
| Immigrants | England | 99.3 /100 | #76 | Exceptional 98.3% |
| Delaware | 99.3 /100 | #77 | Exceptional 98.3% |
| Shoshone | 99.2 /100 | #78 | Exceptional 98.3% |
| Immigrants | Belgium | 99.2 /100 | #79 | Exceptional 98.3% |
| Immigrants | Lithuania | 99.2 /100 | #80 | Exceptional 98.3% |
| Icelanders | 99.2 /100 | #81 | Exceptional 98.3% |
| Potawatomi | 99.2 /100 | #82 | Exceptional 98.3% |
| Osage | 99.1 /100 | #83 | Exceptional 98.3% |
| Immigrants | Denmark | 99.1 /100 | #84 | Exceptional 98.3% |
| Immigrants | Sweden | 99.1 /100 | #85 | Exceptional 98.3% |
| Hopi | 99.0 /100 | #86 | Exceptional 98.3% |
| Immigrants | Australia | 99.0 /100 | #87 | Exceptional 98.3% |
| Ukrainians | 98.8 /100 | #88 | Exceptional 98.3% |
| Immigrants | South Africa | 98.8 /100 | #89 | Exceptional 98.3% |