Immigrants from Eastern Europe vs Immigrants from Italy 12th Grade, No Diploma
COMPARE
Immigrants from Eastern Europe
Immigrants from Italy
12th Grade, No Diploma
12th Grade, No Diploma Comparison
Immigrants from Eastern Europe
Immigrants from Italy
92.1%
12TH GRADE, NO DIPLOMA
96.3/ 100
METRIC RATING
117th/ 347
METRIC RANK
91.7%
12TH GRADE, NO DIPLOMA
88.3/ 100
METRIC RATING
133rd/ 347
METRIC RANK
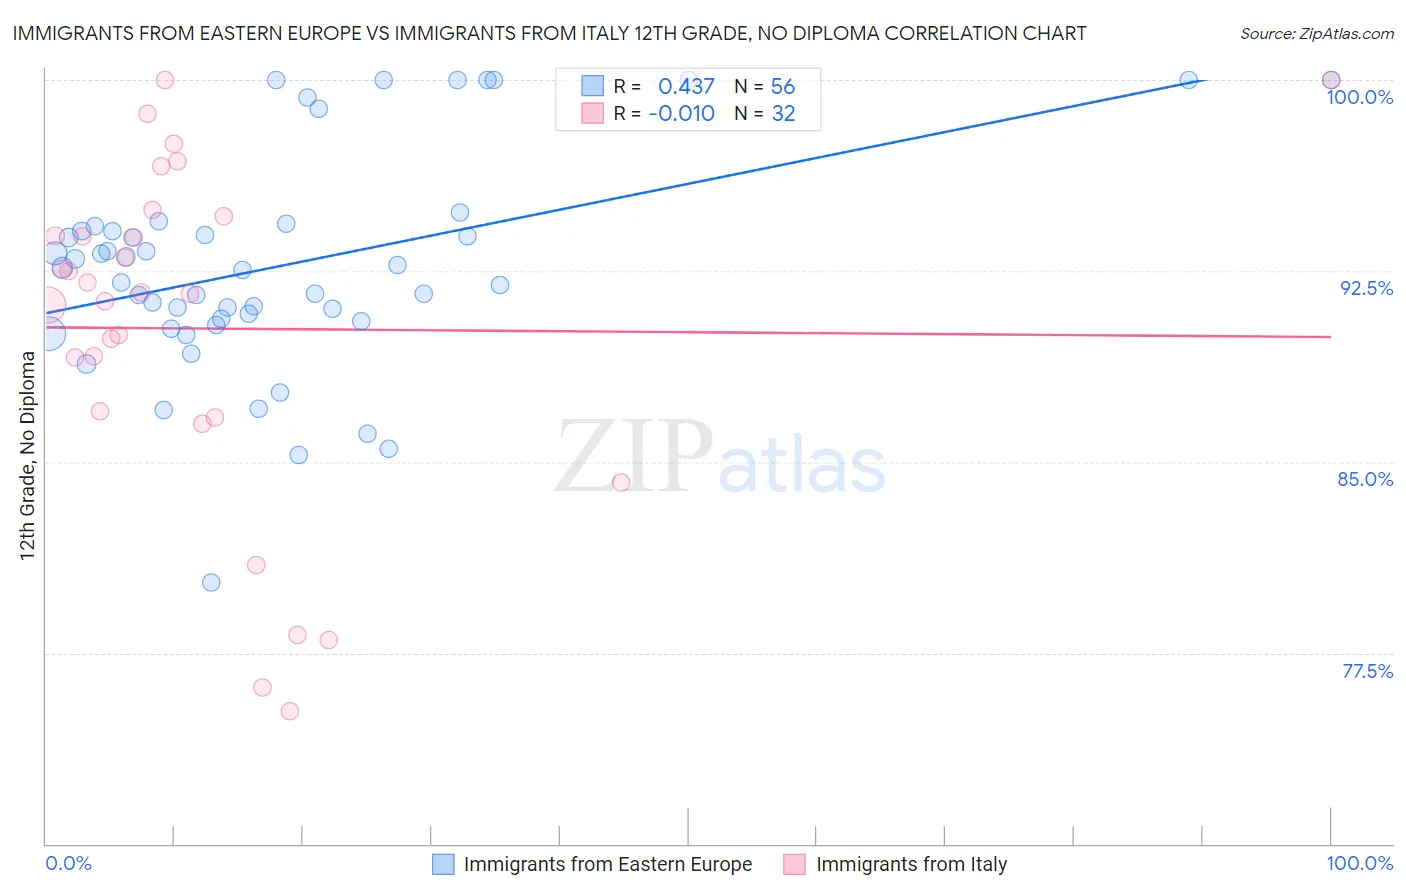
Immigrants from Eastern Europe vs Immigrants from Italy 12th Grade, No Diploma Correlation Chart
The statistical analysis conducted on geographies consisting of 475,879,420 people shows a moderate positive correlation between the proportion of Immigrants from Eastern Europe and percentage of population with at least 12th grade (no diploma) education in the United States with a correlation coefficient (R) of 0.437 and weighted average of 92.1%. Similarly, the statistical analysis conducted on geographies consisting of 324,226,009 people shows no correlation between the proportion of Immigrants from Italy and percentage of population with at least 12th grade (no diploma) education in the United States with a correlation coefficient (R) of -0.010 and weighted average of 91.7%, a difference of 0.38%.
12th Grade, No Diploma Correlation Summary
| Measurement | Immigrants from Eastern Europe | Immigrants from Italy |
| Minimum | 80.3% | 75.2% |
| Maximum | 100.0% | 100.0% |
| Range | 19.7% | 24.8% |
| Mean | 92.7% | 90.2% |
| Median | 92.6% | 91.6% |
| Interquartile 25% (IQ1) | 90.6% | 86.9% |
| Interquartile 75% (IQ3) | 94.2% | 94.3% |
| Interquartile Range (IQR) | 3.6% | 7.4% |
| Standard Deviation (Sample) | 4.3% | 6.7% |
| Standard Deviation (Population) | 4.2% | 6.6% |
Demographics Similar to Immigrants from Eastern Europe and Immigrants from Italy by 12th Grade, No Diploma
In terms of 12th grade, no diploma, the demographic groups most similar to Immigrants from Eastern Europe are Aleut (92.1%, a difference of 0.0%), Immigrants from Sri Lanka (92.1%, a difference of 0.010%), Puget Sound Salish (92.0%, a difference of 0.040%), Immigrants from Germany (92.0%, a difference of 0.060%), and Immigrants from Kazakhstan (91.9%, a difference of 0.14%). Similarly, the demographic groups most similar to Immigrants from Italy are Venezuelan (91.7%, a difference of 0.0%), Albanian (91.8%, a difference of 0.030%), Immigrants from Eastern Asia (91.8%, a difference of 0.030%), Immigrants from Bosnia and Herzegovina (91.7%, a difference of 0.030%), and Assyrian/Chaldean/Syriac (91.8%, a difference of 0.040%).
| Demographics | Rating | Rank | 12th Grade, No Diploma |
| Immigrants | Sri Lanka | 96.4 /100 | #115 | Exceptional 92.1% |
| Aleuts | 96.3 /100 | #116 | Exceptional 92.1% |
| Immigrants | Eastern Europe | 96.3 /100 | #117 | Exceptional 92.1% |
| Puget Sound Salish | 95.8 /100 | #118 | Exceptional 92.0% |
| Immigrants | Germany | 95.5 /100 | #119 | Exceptional 92.0% |
| Immigrants | Kazakhstan | 94.2 /100 | #120 | Exceptional 91.9% |
| Menominee | 93.5 /100 | #121 | Exceptional 91.9% |
| Ottawa | 93.1 /100 | #122 | Exceptional 91.9% |
| Egyptians | 92.5 /100 | #123 | Exceptional 91.9% |
| Immigrants | Ukraine | 91.6 /100 | #124 | Exceptional 91.8% |
| Whites/Caucasians | 91.6 /100 | #125 | Exceptional 91.8% |
| Basques | 91.3 /100 | #126 | Exceptional 91.8% |
| Immigrants | Jordan | 91.0 /100 | #127 | Exceptional 91.8% |
| Mongolians | 89.9 /100 | #128 | Excellent 91.8% |
| German Russians | 89.8 /100 | #129 | Excellent 91.8% |
| Assyrians/Chaldeans/Syriacs | 89.6 /100 | #130 | Excellent 91.8% |
| Albanians | 89.3 /100 | #131 | Excellent 91.8% |
| Immigrants | Eastern Asia | 89.3 /100 | #132 | Excellent 91.8% |
| Immigrants | Italy | 88.3 /100 | #133 | Excellent 91.7% |
| Venezuelans | 88.2 /100 | #134 | Excellent 91.7% |
| Immigrants | Bosnia and Herzegovina | 87.3 /100 | #135 | Excellent 91.7% |