Immigrants from Eastern Europe vs Immigrants from Bahamas Doctorate Degree

COMPARE

Immigrants from Eastern Europe
Race
Ancestry
AfghanAfricanAlaska NativeAlaskan AthabascanAlbanianAleutAlsatianAmericanApacheArabArapahoArgentineanArmenianAssyrian/Chaldean/SyriacAustralianAustrianBahamianBangladeshiBarbadianBasqueBelgianBelizeanBermudanBhutaneseBlackfeetBolivianBrazilianBritishBritish West IndianBulgarianBurmeseCajunCambodianCanadianCape VerdeanCarpatho RusynCelticCentral AmericanCentral American IndianCherokeeCheyenneChickasawChileanChineseChippewaChoctawColombianColvilleComancheCosta RicanCreeCreekCroatianCrowCubanCypriotCzechCzechoslovakianDanishDelawareDominicanDutchDutch West IndianEastern EuropeanEcuadorianEgyptianEnglishEstonianEthiopianEuropeanFijianFilipinoFinnishFrenchFrench American IndianFrench CanadianGermanGerman RussianGhanaianGreekGuamanian/ChamorroGuatemalanGuyaneseHaitianHmongHonduranHopiHoumaHungarianIcelanderIndian (Asian)IndonesianInupiatIranianIraqiIrishIroquoisIsraeliItalianJamaicanJapaneseJordanianKenyanKiowaKoreanLaotianLatvianLebaneseLiberianLithuanianLumbeeLuxembourgerMacedonianMalaysianMalteseMarshalleseMenomineeMexicanMexican American IndianMongolianMoroccanNative HawaiianNavajoNepaleseNew ZealanderNicaraguanNigerianNorthern EuropeanNorwegianOkinawanOsageOttawaPaiutePakistaniPalestinianPanamanianParaguayanPennsylvania GermanPeruvianPimaPolishPortuguesePotawatomiPuebloPuerto RicanPuget Sound SalishRomanianRussianSalvadoranSamoanScandinavianScotch-IrishScottishSeminoleSenegaleseSerbianShoshoneSierra LeoneanSiouxSlavicSlovakSloveneSomaliSouth AfricanSouth AmericanSouth American IndianSoviet UnionSpaniardSpanishSpanish AmericanSpanish American IndianSri LankanSubsaharan AfricanSudaneseSwedishSwissSyrianTaiwaneseThaiTlingit-HaidaTohono O'OdhamTonganTrinidadian and TobagonianTsimshianTurkishU.S. Virgin IslanderUgandanUkrainianUruguayanUteVenezuelanVietnameseWelshWest IndianYakamaYaquiYugoslavianYumanYup'ikZimbabwean
Immigration
NonimmigrantsImmigrantsAfghanistanAfricaAlbaniaArgentinaArmeniaAsiaAustraliaAustriaBangladeshBarbadosBelarusBelgiumBelizeBoliviaBosnia and HerzegovinaBrazilBulgariaBurma/MyanmarCabo VerdeCambodiaCameroonCanadaCaribbeanCentral AmericaChileChinaColombiaCongoCosta RicaCroatiaCubaCzechoslovakiaDenmarkDominicaDominican RepublicEastern AfricaEastern AsiaEastern EuropeEcuadorEgyptEl SalvadorEnglandEritreaEthiopiaEuropeFijiFranceGermanyGhanaGreeceGrenadaGuatemalaGuyanaHaitiHondurasHong KongHungaryIndiaIndonesiaIranIraqIrelandIsraelItalyJamaicaJapanJordanKazakhstanKenyaKoreaKuwaitLaosLatin AmericaLatviaLebanonLiberiaLithuaniaMalaysiaMexicoMicronesiaMiddle AfricaMoldovaMoroccoNepalNetherlandsNicaraguaNigeriaNorth AmericaNorth MacedoniaNorthern AfricaNorthern EuropeNorwayOceaniaPakistanPanamaPeruPhilippinesPolandPortugalRomaniaRussiaSaudi ArabiaScotlandSenegalSerbiaSierra LeoneSingaporeSomaliaSouth AfricaSouth AmericaSouth Central AsiaSouth Eastern AsiaSouthern EuropeSpainSri LankaSt. Vincent and the GrenadinesSudanSwedenSwitzerlandSyriaTaiwanThailandTrinidad and TobagoTurkeyUgandaUkraineUruguayUzbekistanVenezuelaVietnamWest IndiesWestern AfricaWestern AsiaWestern EuropeYemenZaireZimbabweAzores
Immigrants from Bahamas
Race
Ancestry
AfghanAfricanAlaska NativeAlaskan AthabascanAlbanianAleutAlsatianAmericanApacheArabArapahoArgentineanArmenianAssyrian/Chaldean/SyriacAustralianAustrianBahamianBangladeshiBarbadianBasqueBelgianBelizeanBermudanBhutaneseBlackfeetBolivianBrazilianBritishBritish West IndianBulgarianBurmeseCajunCambodianCanadianCape VerdeanCarpatho RusynCelticCentral AmericanCentral American IndianCherokeeCheyenneChickasawChileanChineseChippewaChoctawColombianColvilleComancheCosta RicanCreeCreekCroatianCrowCubanCypriotCzechCzechoslovakianDanishDelawareDominicanDutchDutch West IndianEastern EuropeanEcuadorianEgyptianEnglishEstonianEthiopianEuropeanFijianFilipinoFinnishFrenchFrench American IndianFrench CanadianGermanGerman RussianGhanaianGreekGuamanian/ChamorroGuatemalanGuyaneseHaitianHmongHonduranHopiHoumaHungarianIcelanderIndian (Asian)IndonesianInupiatIranianIraqiIrishIroquoisIsraeliItalianJamaicanJapaneseJordanianKenyanKiowaKoreanLaotianLatvianLebaneseLiberianLithuanianLumbeeLuxembourgerMacedonianMalaysianMalteseMarshalleseMenomineeMexicanMexican American IndianMongolianMoroccanNative HawaiianNavajoNepaleseNew ZealanderNicaraguanNigerianNorthern EuropeanNorwegianOkinawanOsageOttawaPaiutePakistaniPalestinianPanamanianParaguayanPennsylvania GermanPeruvianPimaPolishPortuguesePotawatomiPuebloPuerto RicanPuget Sound SalishRomanianRussianSalvadoranSamoanScandinavianScotch-IrishScottishSeminoleSenegaleseSerbianShoshoneSierra LeoneanSiouxSlavicSlovakSloveneSomaliSouth AfricanSouth AmericanSouth American IndianSoviet UnionSpaniardSpanishSpanish AmericanSpanish American IndianSri LankanSubsaharan AfricanSudaneseSwedishSwissSyrianTaiwaneseThaiTlingit-HaidaTohono O'OdhamTonganTrinidadian and TobagonianTsimshianTurkishU.S. Virgin IslanderUgandanUkrainianUruguayanUteVenezuelanVietnameseWelshWest IndianYakamaYaquiYugoslavianYumanYup'ikZimbabwean
Immigration
NonimmigrantsImmigrantsAfghanistanAfricaAlbaniaArgentinaArmeniaAsiaAustraliaAustriaBahamasBangladeshBarbadosBelarusBelgiumBelizeBoliviaBosnia and HerzegovinaBrazilBulgariaBurma/MyanmarCabo VerdeCambodiaCameroonCanadaCaribbeanCentral AmericaChileChinaColombiaCongoCosta RicaCroatiaCubaCzechoslovakiaDenmarkDominicaDominican RepublicEastern AfricaEastern AsiaEcuadorEgyptEl SalvadorEnglandEritreaEthiopiaEuropeFijiFranceGermanyGhanaGreeceGrenadaGuatemalaGuyanaHaitiHondurasHong KongHungaryIndiaIndonesiaIranIraqIrelandIsraelItalyJamaicaJapanJordanKazakhstanKenyaKoreaKuwaitLaosLatin AmericaLatviaLebanonLiberiaLithuaniaMalaysiaMexicoMicronesiaMiddle AfricaMoldovaMoroccoNepalNetherlandsNicaraguaNigeriaNorth AmericaNorth MacedoniaNorthern AfricaNorthern EuropeNorwayOceaniaPakistanPanamaPeruPhilippinesPolandPortugalRomaniaRussiaSaudi ArabiaScotlandSenegalSerbiaSierra LeoneSingaporeSomaliaSouth AfricaSouth AmericaSouth Central AsiaSouth Eastern AsiaSouthern EuropeSpainSri LankaSt. Vincent and the GrenadinesSudanSwedenSwitzerlandSyriaTaiwanThailandTrinidad and TobagoTurkeyUgandaUkraineUruguayUzbekistanVenezuelaVietnamWest IndiesWestern AfricaWestern AsiaWestern EuropeYemenZaireZimbabweAzores
Doctorate Degree
Income
Poverty
Unemployment
Labor Participation
Family Structure
Vehicle Availability
Education Level
Disability

Doctorate Degree Comparison

Immigrants from Eastern Europe

Immigrants from Bahamas

Exceptional
Tragic
2.1%
DOCTORATE DEGREE
98.2/ 100
METRIC RATING
100th/ 347
METRIC RANK
1.5%
DOCTORATE DEGREE
0.7/ 100
METRIC RATING
263rd/ 347
METRIC RANK

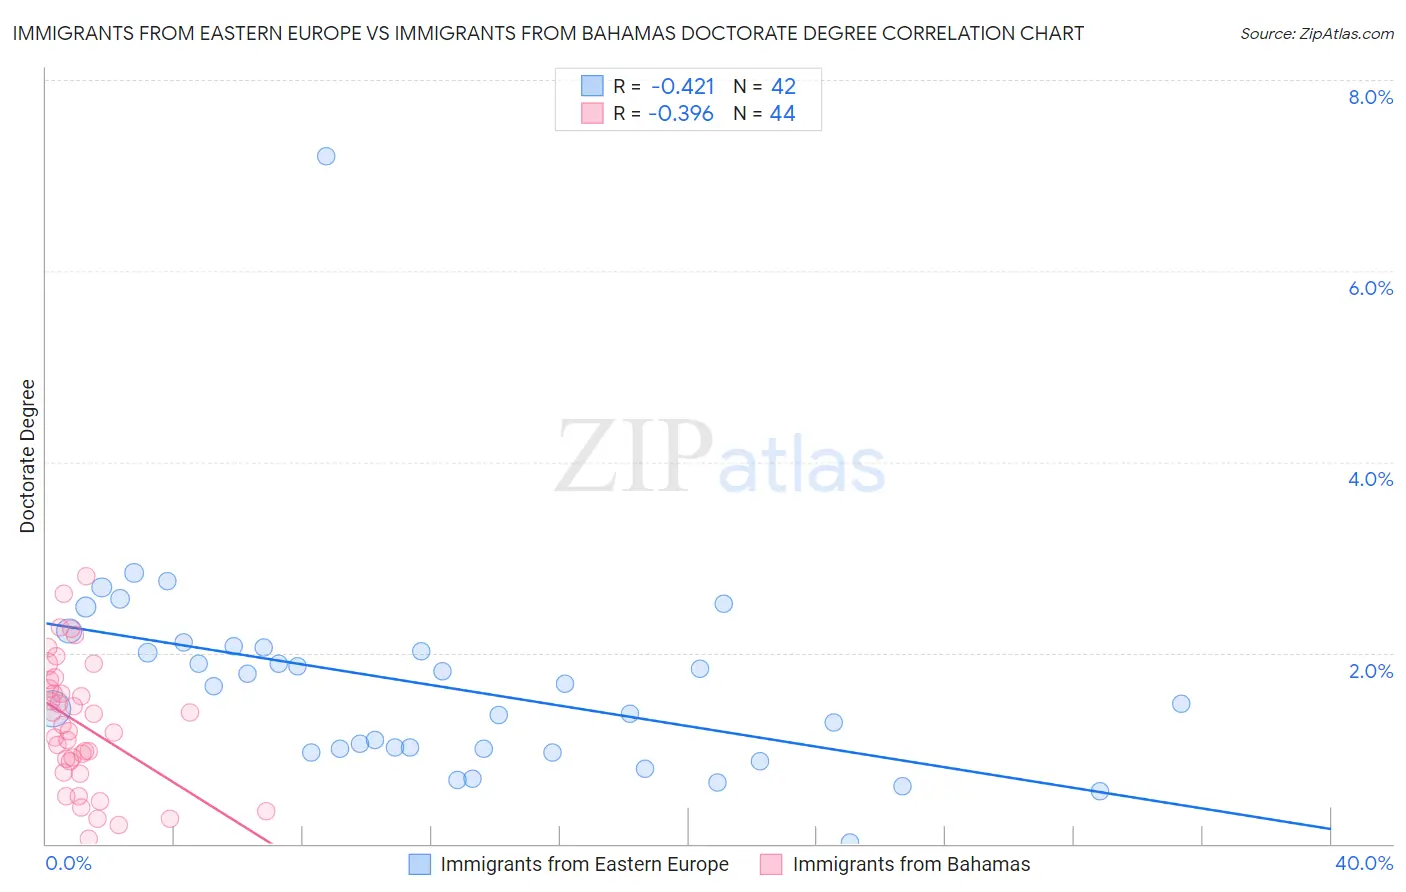
Immigrants from Eastern Europe vs Immigrants from Bahamas Doctorate Degree Correlation Chart

The statistical analysis conducted on geographies consisting of 469,545,565 people shows a moderate negative correlation between the proportion of Immigrants from Eastern Europe and percentage of population with at least doctorate degree education in the United States with a correlation coefficient (R) of -0.421 and weighted average of 2.1%. Similarly, the statistical analysis conducted on geographies consisting of 104,472,552 people shows a mild negative correlation between the proportion of Immigrants from Bahamas and percentage of population with at least doctorate degree education in the United States with a correlation coefficient (R) of -0.396 and weighted average of 1.5%, a difference of 40.0%.
Immigrants from Eastern Europe vs Immigrants from Bahamas Doctorate Degree

Doctorate Degree Correlation Summary

MeasurementImmigrants from Eastern EuropeImmigrants from Bahamas
Minimum0.013%0.056%
Maximum7.2%2.8%
Range7.2%2.7%
Mean1.7%1.2%
Median1.6%1.2%
Interquartile 25% (IQ1)0.99%0.80%
Interquartile 75% (IQ3)2.1%1.7%
Interquartile Range (IQR)1.1%0.87%
Standard Deviation (Sample)1.1%0.67%
Standard Deviation (Population)1.1%0.66%

Similar Demographics by Doctorate Degree

Demographics Similar to Immigrants from Eastern Europe by Doctorate Degree

In terms of doctorate degree, the demographic groups most similar to Immigrants from Eastern Europe are Immigrants from Egypt (2.1%, a difference of 0.0%), Immigrants from Eastern Africa (2.1%, a difference of 0.030%), Armenian (2.1%, a difference of 0.18%), Immigrants from Chile (2.1%, a difference of 0.25%), and Immigrants from Eritrea (2.1%, a difference of 0.26%).
DemographicsRating | RankDoctorate Degree
Alsatians
99.0
/100
|
#93
Exceptional
2.1%
Greeks
98.8
/100
|
#94
Exceptional
2.1%
Immigrants | Romania
98.7
/100
|
#95
Exceptional
2.1%
Immigrants | Northern Africa
98.4
/100
|
#96
Exceptional
2.1%
Immigrants | Eritrea
98.4
/100
|
#97
Exceptional
2.1%
Armenians
98.3
/100
|
#98
Exceptional
2.1%
Immigrants | Egypt
98.2
/100
|
#99
Exceptional
2.1%
Immigrants | Eastern Europe
98.2
/100
|
#100
Exceptional
2.1%
Immigrants | Eastern Africa
98.2
/100
|
#101
Exceptional
2.1%
Immigrants | Chile
98.1
/100
|
#102
Exceptional
2.1%
Romanians
98.1
/100
|
#103
Exceptional
2.1%
Austrians
98.0
/100
|
#104
Exceptional
2.1%
Arabs
97.8
/100
|
#105
Exceptional
2.1%
Sudanese
97.7
/100
|
#106
Exceptional
2.1%
Europeans
97.5
/100
|
#107
Exceptional
2.1%

Demographics Similar to Immigrants from Bahamas by Doctorate Degree

In terms of doctorate degree, the demographic groups most similar to Immigrants from Bahamas are Chickasaw (1.5%, a difference of 0.17%), Blackfeet (1.5%, a difference of 0.18%), Immigrants from Portugal (1.5%, a difference of 0.32%), Nicaraguan (1.5%, a difference of 0.47%), and Japanese (1.5%, a difference of 0.79%).
DemographicsRating | RankDoctorate Degree
Central American Indians
1.0
/100
|
#256
Tragic
1.5%
Chippewa
0.9
/100
|
#257
Tragic
1.5%
Immigrants | West Indies
0.9
/100
|
#258
Tragic
1.5%
Liberians
0.9
/100
|
#259
Tragic
1.5%
Japanese
0.9
/100
|
#260
Tragic
1.5%
Immigrants | Portugal
0.8
/100
|
#261
Tragic
1.5%
Chickasaw
0.7
/100
|
#262
Tragic
1.5%
Immigrants | Bahamas
0.7
/100
|
#263
Tragic
1.5%
Blackfeet
0.7
/100
|
#264
Tragic
1.5%
Nicaraguans
0.6
/100
|
#265
Tragic
1.5%
Immigrants | Liberia
0.5
/100
|
#266
Tragic
1.5%
Kiowa
0.5
/100
|
#267
Tragic
1.5%
U.S. Virgin Islanders
0.5
/100
|
#268
Tragic
1.5%
Crow
0.5
/100
|
#269
Tragic
1.5%
Salvadorans
0.5
/100
|
#270
Tragic
1.5%