Immigrants from Eastern Asia vs Immigrants from Japan College, 1 year or more
COMPARE
Immigrants from Eastern Asia
Immigrants from Japan
College, 1 year or more
College, 1 year or more Comparison
Immigrants from Eastern Asia
Immigrants from Japan
66.6%
COLLEGE, 1 YEAR OR MORE
100.0/ 100
METRIC RATING
17th/ 347
METRIC RANK
66.7%
COLLEGE, 1 YEAR OR MORE
100.0/ 100
METRIC RATING
16th/ 347
METRIC RANK
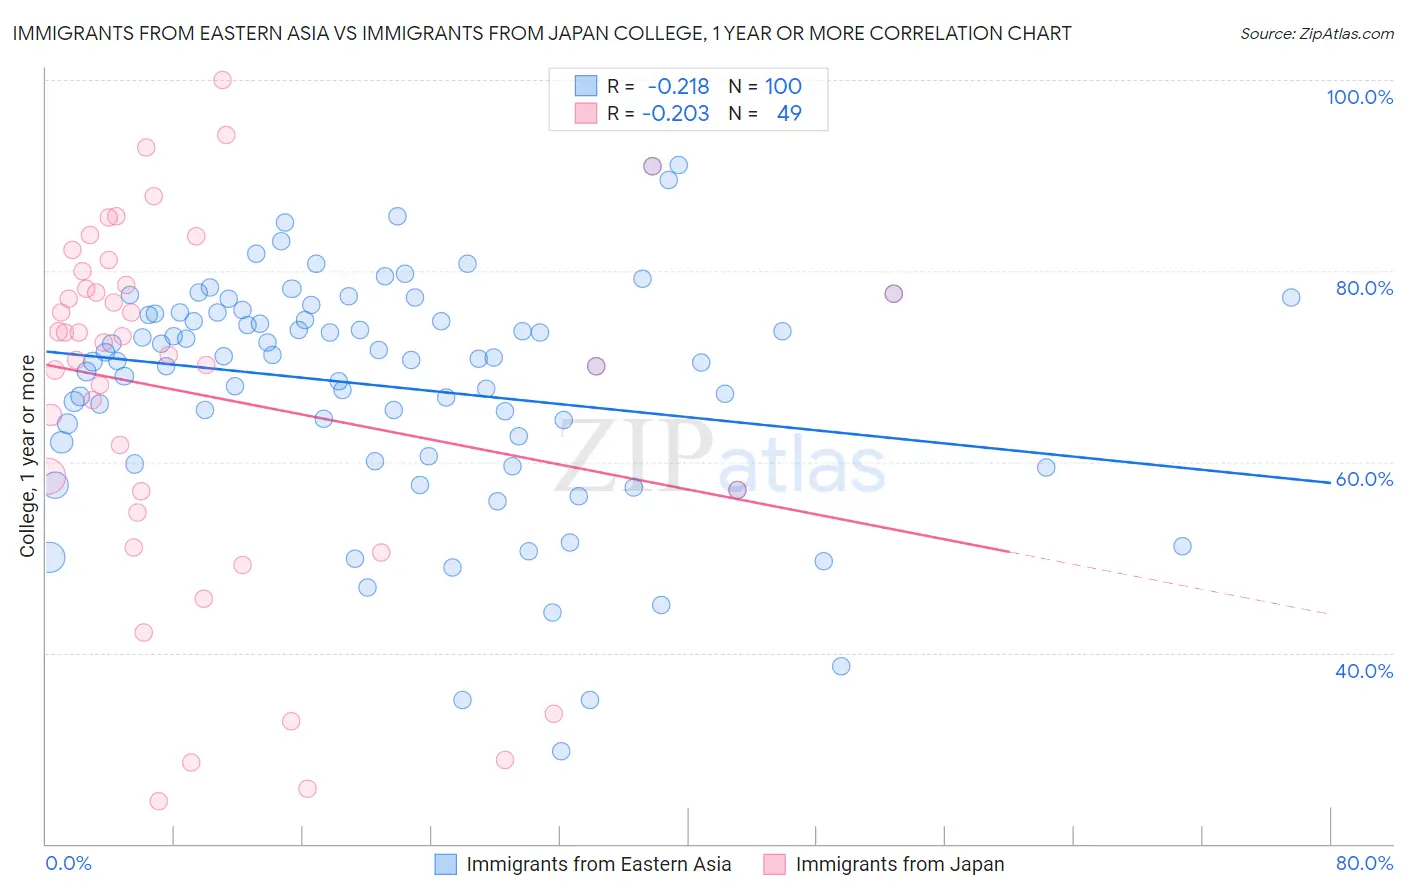
Immigrants from Eastern Asia vs Immigrants from Japan College, 1 year or more Correlation Chart
The statistical analysis conducted on geographies consisting of 499,934,698 people shows a weak negative correlation between the proportion of Immigrants from Eastern Asia and percentage of population with at least college, 1 year or more education in the United States with a correlation coefficient (R) of -0.218 and weighted average of 66.6%. Similarly, the statistical analysis conducted on geographies consisting of 340,147,719 people shows a weak negative correlation between the proportion of Immigrants from Japan and percentage of population with at least college, 1 year or more education in the United States with a correlation coefficient (R) of -0.203 and weighted average of 66.7%, a difference of 0.11%.
College, 1 year or more Correlation Summary
| Measurement | Immigrants from Eastern Asia | Immigrants from Japan |
| Minimum | 29.7% | 24.4% |
| Maximum | 91.1% | 100.0% |
| Range | 61.4% | 75.6% |
| Mean | 67.8% | 67.0% |
| Median | 70.7% | 72.5% |
| Interquartile 25% (IQ1) | 61.3% | 55.8% |
| Interquartile 75% (IQ3) | 75.6% | 79.2% |
| Interquartile Range (IQR) | 14.2% | 23.4% |
| Standard Deviation (Sample) | 12.1% | 19.1% |
| Standard Deviation (Population) | 12.1% | 18.9% |
Demographics Similar to Immigrants from Eastern Asia and Immigrants from Japan by College, 1 year or more
In terms of college, 1 year or more, the demographic groups most similar to Immigrants from Eastern Asia are Eastern European (66.6%, a difference of 0.070%), Immigrants from Switzerland (66.5%, a difference of 0.12%), Burmese (66.7%, a difference of 0.15%), Cambodian (66.7%, a difference of 0.15%), and Immigrants from Korea (66.5%, a difference of 0.17%). Similarly, the demographic groups most similar to Immigrants from Japan are Cambodian (66.7%, a difference of 0.030%), Burmese (66.7%, a difference of 0.040%), Eastern European (66.6%, a difference of 0.19%), Immigrants from Sweden (66.8%, a difference of 0.23%), and Immigrants from Switzerland (66.5%, a difference of 0.24%).
| Demographics | Rating | Rank | College, 1 year or more |
| Immigrants | Iran | 100.0 /100 | #6 | Exceptional 69.5% |
| Okinawans | 100.0 /100 | #7 | Exceptional 69.0% |
| Thais | 100.0 /100 | #8 | Exceptional 68.6% |
| Immigrants | Israel | 100.0 /100 | #9 | Exceptional 67.8% |
| Immigrants | Australia | 100.0 /100 | #10 | Exceptional 67.7% |
| Immigrants | South Central Asia | 100.0 /100 | #11 | Exceptional 67.1% |
| Cypriots | 100.0 /100 | #12 | Exceptional 67.0% |
| Immigrants | Sweden | 100.0 /100 | #13 | Exceptional 66.8% |
| Burmese | 100.0 /100 | #14 | Exceptional 66.7% |
| Cambodians | 100.0 /100 | #15 | Exceptional 66.7% |
| Immigrants | Japan | 100.0 /100 | #16 | Exceptional 66.7% |
| Immigrants | Eastern Asia | 100.0 /100 | #17 | Exceptional 66.6% |
| Eastern Europeans | 100.0 /100 | #18 | Exceptional 66.6% |
| Immigrants | Switzerland | 100.0 /100 | #19 | Exceptional 66.5% |
| Immigrants | Korea | 100.0 /100 | #20 | Exceptional 66.5% |
| Immigrants | Hong Kong | 100.0 /100 | #21 | Exceptional 66.4% |
| Soviet Union | 100.0 /100 | #22 | Exceptional 66.4% |
| Immigrants | China | 100.0 /100 | #23 | Exceptional 66.4% |
| Immigrants | Belgium | 100.0 /100 | #24 | Exceptional 66.3% |
| Indians (Asian) | 100.0 /100 | #25 | Exceptional 66.1% |
| Latvians | 100.0 /100 | #26 | Exceptional 66.1% |