Immigrants from Eastern Asia vs Aleut High School Diploma
COMPARE
Immigrants from Eastern Asia
Aleut
High School Diploma
High School Diploma Comparison
Immigrants from Eastern Asia
Aleuts
89.9%
HIGH SCHOOL DIPLOMA
89.2/ 100
METRIC RATING
127th/ 347
METRIC RANK
90.4%
HIGH SCHOOL DIPLOMA
98.0/ 100
METRIC RATING
102nd/ 347
METRIC RANK
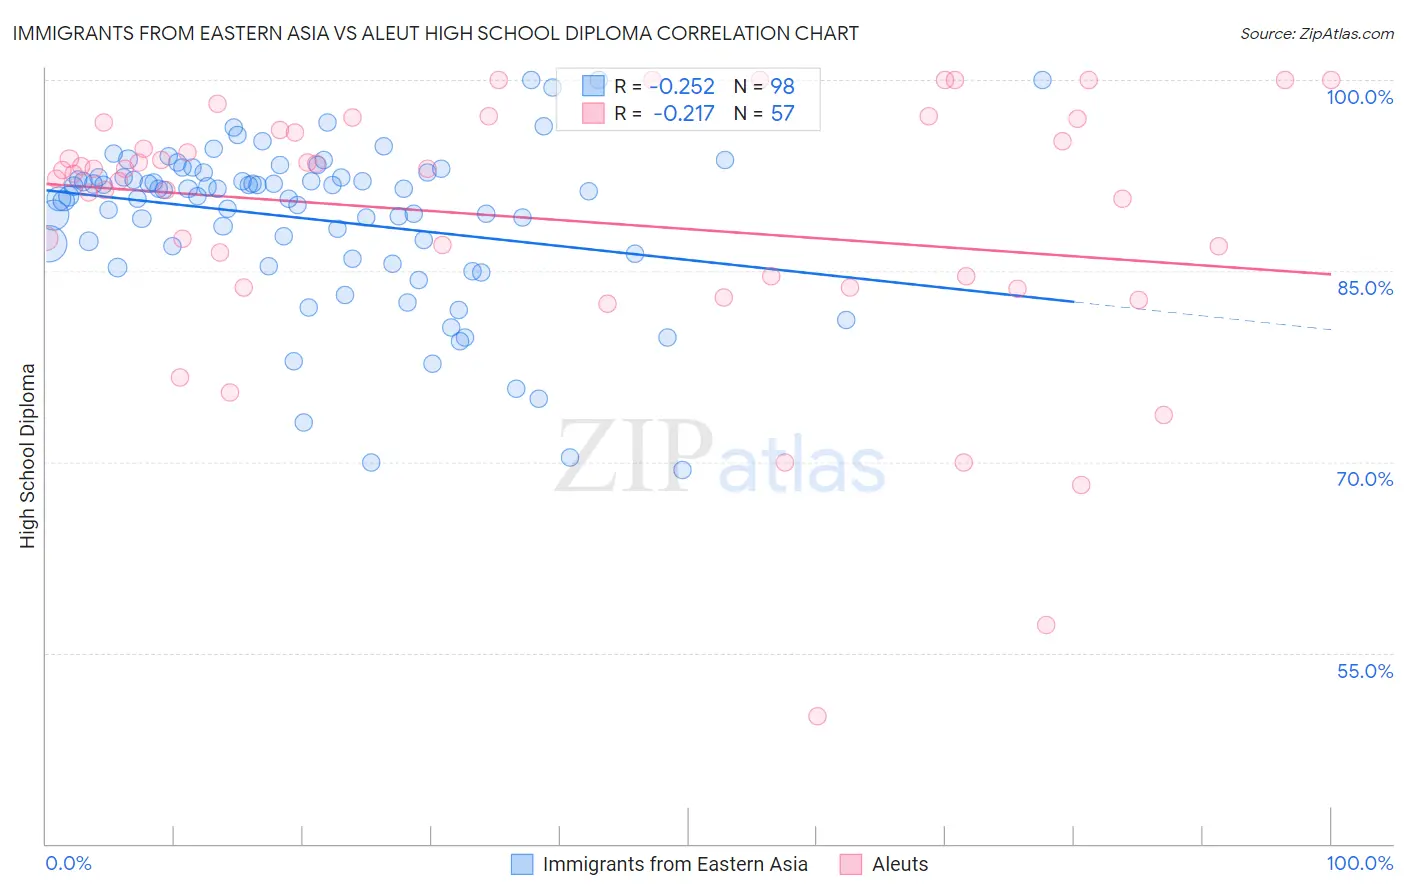
Immigrants from Eastern Asia vs Aleut High School Diploma Correlation Chart
The statistical analysis conducted on geographies consisting of 499,846,164 people shows a weak negative correlation between the proportion of Immigrants from Eastern Asia and percentage of population with at least high school diploma education in the United States with a correlation coefficient (R) of -0.252 and weighted average of 89.9%. Similarly, the statistical analysis conducted on geographies consisting of 61,782,761 people shows a weak negative correlation between the proportion of Aleuts and percentage of population with at least high school diploma education in the United States with a correlation coefficient (R) of -0.217 and weighted average of 90.4%, a difference of 0.66%.
High School Diploma Correlation Summary
| Measurement | Immigrants from Eastern Asia | Aleut |
| Minimum | 69.4% | 50.0% |
| Maximum | 100.0% | 100.0% |
| Range | 30.6% | 50.0% |
| Mean | 89.0% | 89.1% |
| Median | 91.3% | 93.0% |
| Interquartile 25% (IQ1) | 86.3% | 84.2% |
| Interquartile 75% (IQ3) | 92.4% | 96.4% |
| Interquartile Range (IQR) | 6.0% | 12.2% |
| Standard Deviation (Sample) | 6.4% | 10.6% |
| Standard Deviation (Population) | 6.3% | 10.5% |
Similar Demographics by High School Diploma
Demographics Similar to Immigrants from Eastern Asia by High School Diploma
In terms of high school diploma, the demographic groups most similar to Immigrants from Eastern Asia are Puget Sound Salish (89.9%, a difference of 0.0%), Basque (89.8%, a difference of 0.030%), Immigrants from Ukraine (89.8%, a difference of 0.050%), Alaska Native (89.9%, a difference of 0.070%), and Immigrants from Italy (89.8%, a difference of 0.070%).
| Demographics | Rating | Rank | High School Diploma |
| Ottawa | 94.4 /100 | #120 | Exceptional 90.1% |
| Whites/Caucasians | 94.1 /100 | #121 | Exceptional 90.1% |
| Immigrants | Kazakhstan | 93.4 /100 | #122 | Exceptional 90.0% |
| German Russians | 92.0 /100 | #123 | Exceptional 90.0% |
| Mongolians | 91.6 /100 | #124 | Exceptional 89.9% |
| Egyptians | 91.1 /100 | #125 | Exceptional 89.9% |
| Alaska Natives | 91.0 /100 | #126 | Exceptional 89.9% |
| Immigrants | Eastern Asia | 89.2 /100 | #127 | Excellent 89.9% |
| Puget Sound Salish | 89.1 /100 | #128 | Excellent 89.9% |
| Basques | 88.5 /100 | #129 | Excellent 89.8% |
| Immigrants | Ukraine | 87.9 /100 | #130 | Excellent 89.8% |
| Immigrants | Italy | 87.4 /100 | #131 | Excellent 89.8% |
| Immigrants | Bosnia and Herzegovina | 87.3 /100 | #132 | Excellent 89.8% |
| Albanians | 87.2 /100 | #133 | Excellent 89.8% |
| Immigrants | Jordan | 87.2 /100 | #134 | Excellent 89.8% |
Demographics Similar to Aleuts by High School Diploma
In terms of high school diploma, the demographic groups most similar to Aleuts are Immigrants from Norway (90.5%, a difference of 0.010%), Immigrants from Romania (90.4%, a difference of 0.020%), Immigrants from North Macedonia (90.5%, a difference of 0.030%), Immigrants from Croatia (90.4%, a difference of 0.030%), and Immigrants from Europe (90.5%, a difference of 0.040%).
| Demographics | Rating | Rank | High School Diploma |
| Icelanders | 98.5 /100 | #95 | Exceptional 90.5% |
| Immigrants | Serbia | 98.4 /100 | #96 | Exceptional 90.5% |
| Immigrants | Kuwait | 98.3 /100 | #97 | Exceptional 90.5% |
| Immigrants | Korea | 98.3 /100 | #98 | Exceptional 90.5% |
| Immigrants | Europe | 98.2 /100 | #99 | Exceptional 90.5% |
| Immigrants | North Macedonia | 98.1 /100 | #100 | Exceptional 90.5% |
| Immigrants | Norway | 98.0 /100 | #101 | Exceptional 90.5% |
| Aleuts | 98.0 /100 | #102 | Exceptional 90.4% |
| Immigrants | Romania | 97.8 /100 | #103 | Exceptional 90.4% |
| Immigrants | Croatia | 97.8 /100 | #104 | Exceptional 90.4% |
| Lebanese | 97.4 /100 | #105 | Exceptional 90.4% |
| Syrians | 97.0 /100 | #106 | Exceptional 90.3% |
| Immigrants | Russia | 96.9 /100 | #107 | Exceptional 90.3% |
| Palestinians | 96.7 /100 | #108 | Exceptional 90.3% |
| Immigrants | Zimbabwe | 96.7 /100 | #109 | Exceptional 90.3% |