Immigrants from Eastern Africa vs Scottish 6th Grade
COMPARE
Immigrants from Eastern Africa
Scottish
6th Grade
6th Grade Comparison
Immigrants from Eastern Africa
Scottish
96.6%
6TH GRADE
2.0/ 100
METRIC RATING
237th/ 347
METRIC RANK
98.1%
6TH GRADE
100.0/ 100
METRIC RATING
16th/ 347
METRIC RANK
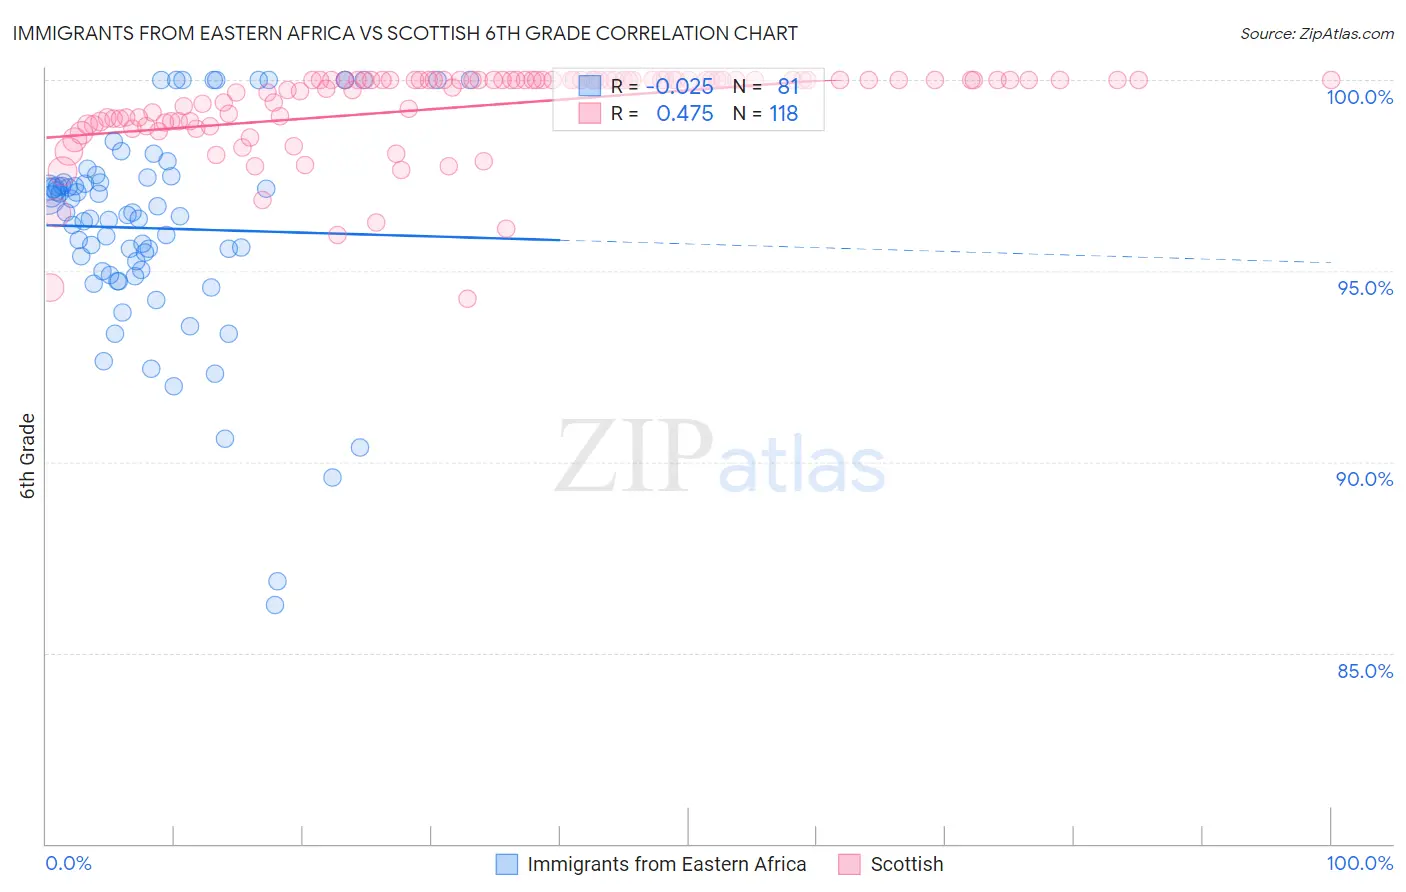
Immigrants from Eastern Africa vs Scottish 6th Grade Correlation Chart
The statistical analysis conducted on geographies consisting of 355,144,184 people shows no correlation between the proportion of Immigrants from Eastern Africa and percentage of population with at least 6th grade education in the United States with a correlation coefficient (R) of -0.025 and weighted average of 96.6%. Similarly, the statistical analysis conducted on geographies consisting of 567,141,733 people shows a moderate positive correlation between the proportion of Scottish and percentage of population with at least 6th grade education in the United States with a correlation coefficient (R) of 0.475 and weighted average of 98.1%, a difference of 1.5%.
6th Grade Correlation Summary
| Measurement | Immigrants from Eastern Africa | Scottish |
| Minimum | 86.3% | 94.3% |
| Maximum | 100.0% | 100.0% |
| Range | 13.7% | 5.7% |
| Mean | 96.1% | 99.3% |
| Median | 96.5% | 100.0% |
| Interquartile 25% (IQ1) | 94.9% | 98.9% |
| Interquartile 75% (IQ3) | 97.4% | 100.0% |
| Interquartile Range (IQR) | 2.4% | 1.1% |
| Standard Deviation (Sample) | 2.8% | 1.1% |
| Standard Deviation (Population) | 2.8% | 1.1% |
Similar Demographics by 6th Grade
Demographics Similar to Immigrants from Eastern Africa by 6th Grade
In terms of 6th grade, the demographic groups most similar to Immigrants from Eastern Africa are Immigrants from Indonesia (96.6%, a difference of 0.010%), Nigerian (96.6%, a difference of 0.010%), Indian (Asian) (96.6%, a difference of 0.010%), Korean (96.6%, a difference of 0.010%), and Senegalese (96.6%, a difference of 0.010%).
| Demographics | Rating | Rank | 6th Grade |
| Immigrants | Eastern Asia | 4.0 /100 | #230 | Tragic 96.7% |
| Sub-Saharan Africans | 3.5 /100 | #231 | Tragic 96.7% |
| South American Indians | 3.5 /100 | #232 | Tragic 96.7% |
| Yuman | 3.2 /100 | #233 | Tragic 96.7% |
| Uruguayans | 2.5 /100 | #234 | Tragic 96.6% |
| Asians | 2.4 /100 | #235 | Tragic 96.6% |
| Immigrants | Indonesia | 2.3 /100 | #236 | Tragic 96.6% |
| Immigrants | Eastern Africa | 2.0 /100 | #237 | Tragic 96.6% |
| Nigerians | 1.9 /100 | #238 | Tragic 96.6% |
| Indians (Asian) | 1.9 /100 | #239 | Tragic 96.6% |
| Koreans | 1.9 /100 | #240 | Tragic 96.6% |
| Senegalese | 1.8 /100 | #241 | Tragic 96.6% |
| Immigrants | Asia | 1.8 /100 | #242 | Tragic 96.6% |
| Immigrants | Liberia | 1.6 /100 | #243 | Tragic 96.6% |
| Ethiopians | 1.5 /100 | #244 | Tragic 96.6% |
Demographics Similar to Scottish by 6th Grade
In terms of 6th grade, the demographic groups most similar to Scottish are Carpatho Rusyn (98.1%, a difference of 0.010%), Inupiat (98.1%, a difference of 0.010%), Polish (98.1%, a difference of 0.010%), Pennsylvania German (98.1%, a difference of 0.010%), and Irish (98.1%, a difference of 0.010%).
| Demographics | Rating | Rank | 6th Grade |
| Slovenes | 100.0 /100 | #9 | Exceptional 98.2% |
| Swedes | 100.0 /100 | #10 | Exceptional 98.2% |
| English | 100.0 /100 | #11 | Exceptional 98.1% |
| Alaskan Athabascans | 100.0 /100 | #12 | Exceptional 98.1% |
| Tlingit-Haida | 100.0 /100 | #13 | Exceptional 98.1% |
| Carpatho Rusyns | 100.0 /100 | #14 | Exceptional 98.1% |
| Inupiat | 100.0 /100 | #15 | Exceptional 98.1% |
| Scottish | 100.0 /100 | #16 | Exceptional 98.1% |
| Poles | 100.0 /100 | #17 | Exceptional 98.1% |
| Pennsylvania Germans | 100.0 /100 | #18 | Exceptional 98.1% |
| Irish | 100.0 /100 | #19 | Exceptional 98.1% |
| Finns | 100.0 /100 | #20 | Exceptional 98.1% |
| Lithuanians | 100.0 /100 | #21 | Exceptional 98.1% |
| Danes | 100.0 /100 | #22 | Exceptional 98.0% |
| Sioux | 100.0 /100 | #23 | Exceptional 98.0% |