Immigrants from Eastern Africa vs Iraqi 11th Grade
COMPARE
Immigrants from Eastern Africa
Iraqi
11th Grade
11th Grade Comparison
Immigrants from Eastern Africa
Iraqis
92.3%
11TH GRADE
24.1/ 100
METRIC RATING
202nd/ 347
METRIC RANK
92.8%
11TH GRADE
74.2/ 100
METRIC RATING
152nd/ 347
METRIC RANK
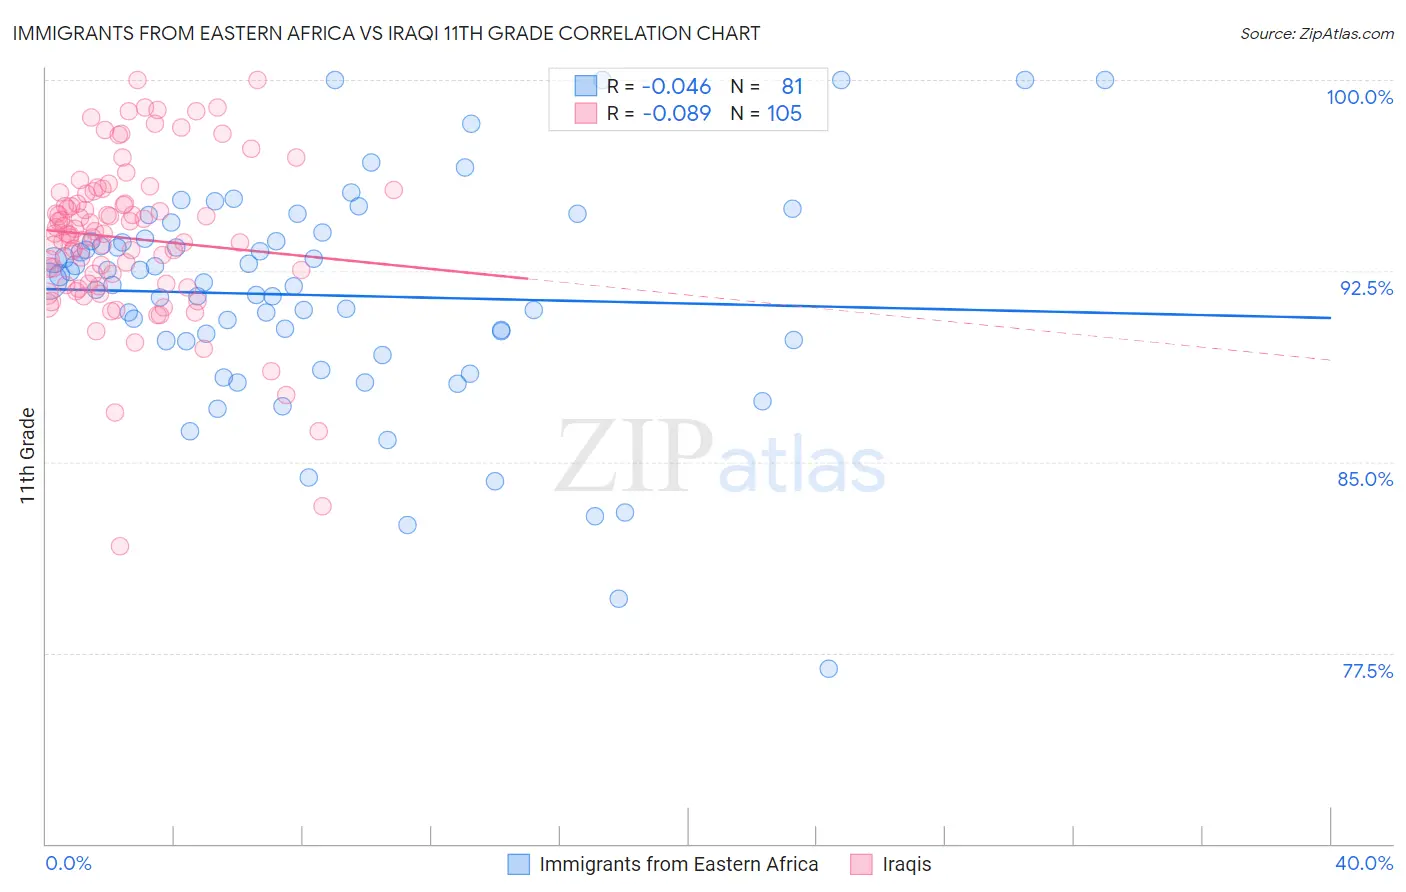
Immigrants from Eastern Africa vs Iraqi 11th Grade Correlation Chart
The statistical analysis conducted on geographies consisting of 355,144,184 people shows no correlation between the proportion of Immigrants from Eastern Africa and percentage of population with at least 11th grade education in the United States with a correlation coefficient (R) of -0.046 and weighted average of 92.3%. Similarly, the statistical analysis conducted on geographies consisting of 170,614,457 people shows a slight negative correlation between the proportion of Iraqis and percentage of population with at least 11th grade education in the United States with a correlation coefficient (R) of -0.089 and weighted average of 92.8%, a difference of 0.54%.
11th Grade Correlation Summary
| Measurement | Immigrants from Eastern Africa | Iraqi |
| Minimum | 76.9% | 81.7% |
| Maximum | 100.0% | 100.0% |
| Range | 23.1% | 18.3% |
| Mean | 91.5% | 93.8% |
| Median | 92.1% | 94.0% |
| Interquartile 25% (IQ1) | 89.7% | 92.0% |
| Interquartile 75% (IQ3) | 93.7% | 95.6% |
| Interquartile Range (IQR) | 4.0% | 3.6% |
| Standard Deviation (Sample) | 4.4% | 3.1% |
| Standard Deviation (Population) | 4.4% | 3.1% |
Similar Demographics by 11th Grade
Demographics Similar to Immigrants from Eastern Africa by 11th Grade
In terms of 11th grade, the demographic groups most similar to Immigrants from Eastern Africa are Samoan (92.3%, a difference of 0.010%), Immigrants from China (92.3%, a difference of 0.010%), Immigrants from Sudan (92.3%, a difference of 0.010%), Immigrants from Hong Kong (92.2%, a difference of 0.010%), and Kiowa (92.2%, a difference of 0.010%).
| Demographics | Rating | Rank | 11th Grade |
| Liberians | 26.8 /100 | #195 | Fair 92.3% |
| Panamanians | 26.4 /100 | #196 | Fair 92.3% |
| Marshallese | 26.0 /100 | #197 | Fair 92.3% |
| Hawaiians | 25.5 /100 | #198 | Fair 92.3% |
| Immigrants | Uganda | 25.2 /100 | #199 | Fair 92.3% |
| Samoans | 25.1 /100 | #200 | Fair 92.3% |
| Immigrants | China | 25.1 /100 | #201 | Fair 92.3% |
| Immigrants | Eastern Africa | 24.1 /100 | #202 | Fair 92.3% |
| Immigrants | Sudan | 23.5 /100 | #203 | Fair 92.3% |
| Immigrants | Hong Kong | 23.3 /100 | #204 | Fair 92.2% |
| Kiowa | 23.2 /100 | #205 | Fair 92.2% |
| Bolivians | 23.2 /100 | #206 | Fair 92.2% |
| Immigrants | Oceania | 22.4 /100 | #207 | Fair 92.2% |
| Colville | 21.8 /100 | #208 | Fair 92.2% |
| Tongans | 19.8 /100 | #209 | Poor 92.2% |
Demographics Similar to Iraqis by 11th Grade
In terms of 11th grade, the demographic groups most similar to Iraqis are Potawatomi (92.8%, a difference of 0.0%), Brazilian (92.8%, a difference of 0.0%), Osage (92.7%, a difference of 0.010%), Argentinean (92.7%, a difference of 0.010%), and Immigrants from Spain (92.7%, a difference of 0.020%).
| Demographics | Rating | Rank | 11th Grade |
| Pakistanis | 79.6 /100 | #145 | Good 92.8% |
| Iroquois | 79.1 /100 | #146 | Good 92.8% |
| Immigrants | Kenya | 78.7 /100 | #147 | Good 92.8% |
| Hmong | 78.6 /100 | #148 | Good 92.8% |
| Immigrants | Poland | 78.5 /100 | #149 | Good 92.8% |
| Immigrants | Egypt | 77.5 /100 | #150 | Good 92.8% |
| Potawatomi | 74.3 /100 | #151 | Good 92.8% |
| Iraqis | 74.2 /100 | #152 | Good 92.8% |
| Brazilians | 73.9 /100 | #153 | Good 92.8% |
| Osage | 73.4 /100 | #154 | Good 92.7% |
| Argentineans | 73.4 /100 | #155 | Good 92.7% |
| Immigrants | Spain | 73.0 /100 | #156 | Good 92.7% |
| Immigrants | Eastern Asia | 72.6 /100 | #157 | Good 92.7% |
| Immigrants | Venezuela | 72.0 /100 | #158 | Good 92.7% |
| Americans | 71.7 /100 | #159 | Good 92.7% |