Immigrants from Dominican Republic vs Iroquois 1st Grade
COMPARE
Immigrants from Dominican Republic
Iroquois
1st Grade
1st Grade Comparison
Immigrants from Dominican Republic
Iroquois
96.5%
1ST GRADE
0.0/ 100
METRIC RATING
333rd/ 347
METRIC RANK
98.1%
1ST GRADE
93.8/ 100
METRIC RATING
123rd/ 347
METRIC RANK
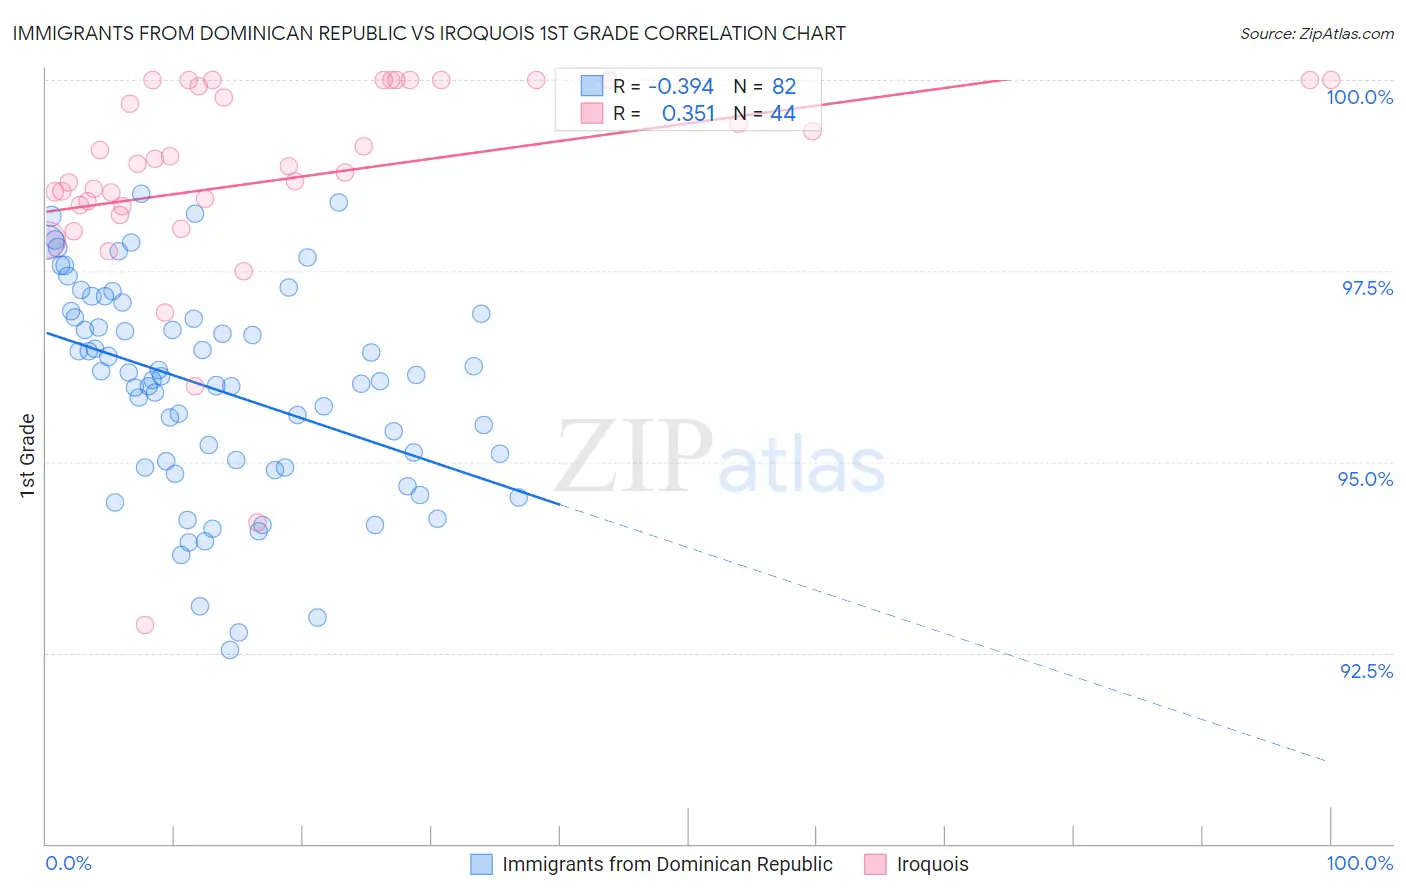
Immigrants from Dominican Republic vs Iroquois 1st Grade Correlation Chart
The statistical analysis conducted on geographies consisting of 275,142,551 people shows a mild negative correlation between the proportion of Immigrants from Dominican Republic and percentage of population with at least 1st grade education in the United States with a correlation coefficient (R) of -0.394 and weighted average of 96.5%. Similarly, the statistical analysis conducted on geographies consisting of 207,308,056 people shows a mild positive correlation between the proportion of Iroquois and percentage of population with at least 1st grade education in the United States with a correlation coefficient (R) of 0.351 and weighted average of 98.1%, a difference of 1.7%.
1st Grade Correlation Summary
| Measurement | Immigrants from Dominican Republic | Iroquois |
| Minimum | 92.5% | 92.9% |
| Maximum | 98.5% | 100.0% |
| Range | 6.0% | 7.1% |
| Mean | 96.0% | 98.7% |
| Median | 96.1% | 98.9% |
| Interquartile 25% (IQ1) | 94.9% | 98.4% |
| Interquartile 75% (IQ3) | 96.9% | 100.0% |
| Interquartile Range (IQR) | 2.0% | 1.6% |
| Standard Deviation (Sample) | 1.4% | 1.5% |
| Standard Deviation (Population) | 1.4% | 1.5% |
Similar Demographics by 1st Grade
Demographics Similar to Immigrants from Dominican Republic by 1st Grade
In terms of 1st grade, the demographic groups most similar to Immigrants from Dominican Republic are Bangladeshi (96.5%, a difference of 0.0%), Central American (96.5%, a difference of 0.010%), Yakama (96.5%, a difference of 0.020%), Guatemalan (96.5%, a difference of 0.050%), and Immigrants from Armenia (96.6%, a difference of 0.060%).
| Demographics | Rating | Rank | 1st Grade |
| Indonesians | 0.0 /100 | #326 | Tragic 96.7% |
| Mexicans | 0.0 /100 | #327 | Tragic 96.7% |
| Immigrants | Latin America | 0.0 /100 | #328 | Tragic 96.7% |
| Japanese | 0.0 /100 | #329 | Tragic 96.6% |
| Immigrants | Vietnam | 0.0 /100 | #330 | Tragic 96.6% |
| Immigrants | Armenia | 0.0 /100 | #331 | Tragic 96.6% |
| Central Americans | 0.0 /100 | #332 | Tragic 96.5% |
| Immigrants | Dominican Republic | 0.0 /100 | #333 | Tragic 96.5% |
| Bangladeshis | 0.0 /100 | #334 | Tragic 96.5% |
| Yakama | 0.0 /100 | #335 | Tragic 96.5% |
| Guatemalans | 0.0 /100 | #336 | Tragic 96.5% |
| Immigrants | Cambodia | 0.0 /100 | #337 | Tragic 96.5% |
| Immigrants | Fiji | 0.0 /100 | #338 | Tragic 96.4% |
| Immigrants | Guatemala | 0.0 /100 | #339 | Tragic 96.4% |
| Immigrants | Cabo Verde | 0.0 /100 | #340 | Tragic 96.3% |
Demographics Similar to Iroquois by 1st Grade
In terms of 1st grade, the demographic groups most similar to Iroquois are Immigrants from Zimbabwe (98.1%, a difference of 0.0%), Menominee (98.1%, a difference of 0.0%), Syrian (98.1%, a difference of 0.0%), Immigrants from Japan (98.1%, a difference of 0.0%), and Lebanese (98.1%, a difference of 0.0%).
| Demographics | Rating | Rank | 1st Grade |
| Spanish | 95.9 /100 | #116 | Exceptional 98.2% |
| Yugoslavians | 95.5 /100 | #117 | Exceptional 98.2% |
| Immigrants | France | 95.5 /100 | #118 | Exceptional 98.2% |
| Thais | 94.7 /100 | #119 | Exceptional 98.1% |
| Okinawans | 94.5 /100 | #120 | Exceptional 98.1% |
| Immigrants | Zimbabwe | 94.0 /100 | #121 | Exceptional 98.1% |
| Menominee | 93.9 /100 | #122 | Exceptional 98.1% |
| Iroquois | 93.8 /100 | #123 | Exceptional 98.1% |
| Syrians | 93.7 /100 | #124 | Exceptional 98.1% |
| Immigrants | Japan | 93.7 /100 | #125 | Exceptional 98.1% |
| Lebanese | 93.5 /100 | #126 | Exceptional 98.1% |
| Immigrants | Saudi Arabia | 93.3 /100 | #127 | Exceptional 98.1% |
| Immigrants | Serbia | 92.2 /100 | #128 | Exceptional 98.1% |
| Seminole | 91.9 /100 | #129 | Exceptional 98.1% |
| Immigrants | Croatia | 91.4 /100 | #130 | Exceptional 98.1% |