Immigrants from Dominican Republic vs Immigrants from Western Europe 11th Grade
COMPARE
Immigrants from Dominican Republic
Immigrants from Western Europe
11th Grade
11th Grade Comparison
Immigrants from Dominican Republic
Immigrants from Western Europe
86.9%
11TH GRADE
0.0/ 100
METRIC RATING
336th/ 347
METRIC RANK
93.6%
11TH GRADE
99.2/ 100
METRIC RATING
87th/ 347
METRIC RANK
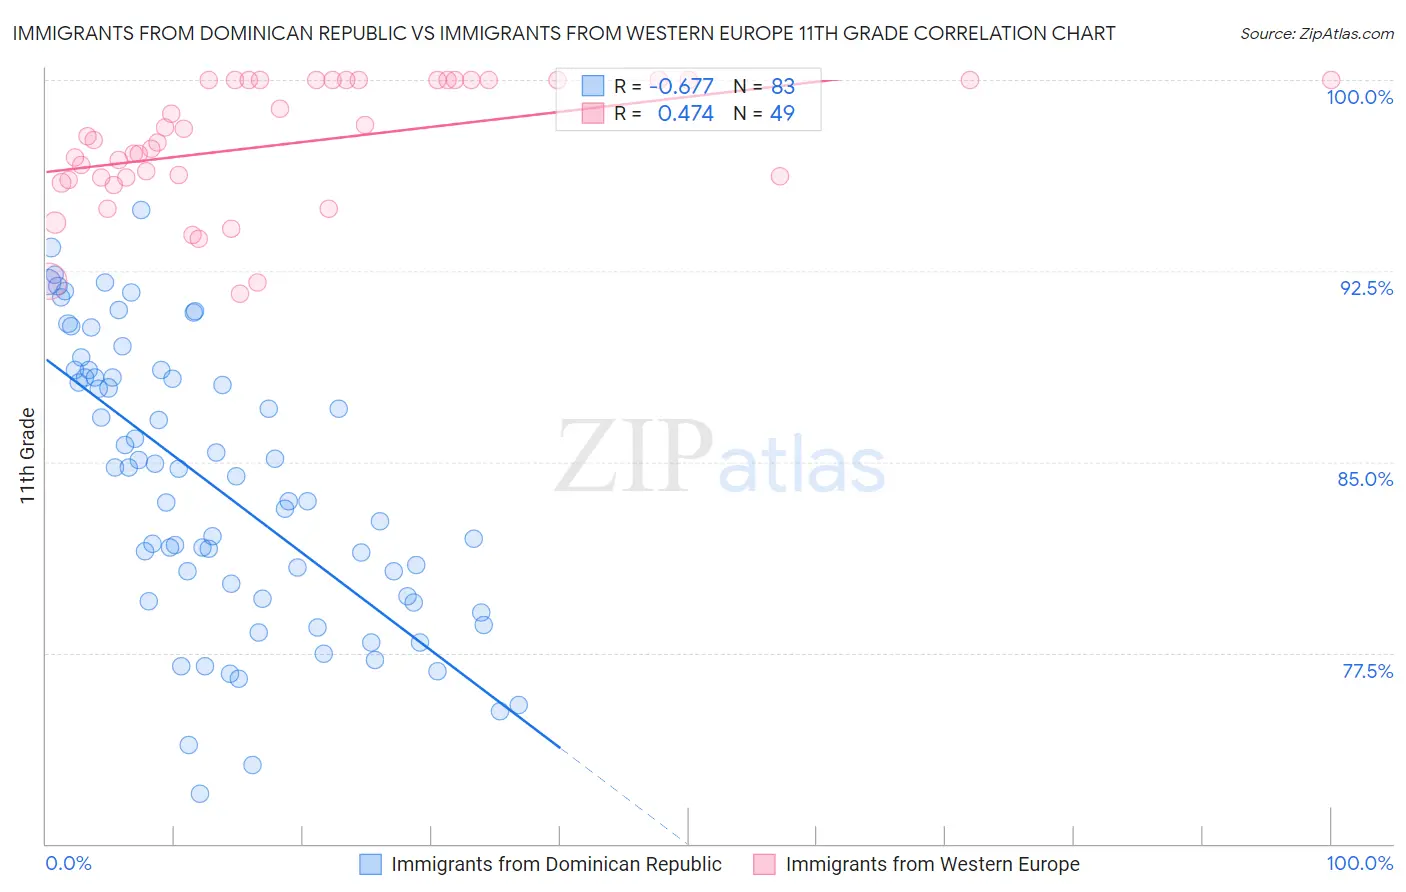
Immigrants from Dominican Republic vs Immigrants from Western Europe 11th Grade Correlation Chart
The statistical analysis conducted on geographies consisting of 275,144,349 people shows a significant negative correlation between the proportion of Immigrants from Dominican Republic and percentage of population with at least 11th grade education in the United States with a correlation coefficient (R) of -0.677 and weighted average of 86.9%. Similarly, the statistical analysis conducted on geographies consisting of 494,080,378 people shows a moderate positive correlation between the proportion of Immigrants from Western Europe and percentage of population with at least 11th grade education in the United States with a correlation coefficient (R) of 0.474 and weighted average of 93.6%, a difference of 7.7%.
11th Grade Correlation Summary
| Measurement | Immigrants from Dominican Republic | Immigrants from Western Europe |
| Minimum | 71.9% | 91.6% |
| Maximum | 94.9% | 100.0% |
| Range | 22.9% | 8.4% |
| Mean | 84.0% | 97.5% |
| Median | 84.4% | 97.6% |
| Interquartile 25% (IQ1) | 79.6% | 96.1% |
| Interquartile 75% (IQ3) | 88.3% | 100.0% |
| Interquartile Range (IQR) | 8.7% | 3.9% |
| Standard Deviation (Sample) | 5.5% | 2.4% |
| Standard Deviation (Population) | 5.4% | 2.4% |
Similar Demographics by 11th Grade
Demographics Similar to Immigrants from Dominican Republic by 11th Grade
In terms of 11th grade, the demographic groups most similar to Immigrants from Dominican Republic are Immigrants from Honduras (86.9%, a difference of 0.0%), Central American (86.9%, a difference of 0.040%), Immigrants from Latin America (86.8%, a difference of 0.12%), Houma (87.0%, a difference of 0.14%), and Immigrants from Yemen (87.1%, a difference of 0.20%).
| Demographics | Rating | Rank | 11th Grade |
| Mexican American Indians | 0.0 /100 | #329 | Tragic 87.5% |
| Hondurans | 0.0 /100 | #330 | Tragic 87.4% |
| Hispanics or Latinos | 0.0 /100 | #331 | Tragic 87.3% |
| Immigrants | Azores | 0.0 /100 | #332 | Tragic 87.2% |
| Immigrants | Yemen | 0.0 /100 | #333 | Tragic 87.1% |
| Houma | 0.0 /100 | #334 | Tragic 87.0% |
| Central Americans | 0.0 /100 | #335 | Tragic 86.9% |
| Immigrants | Dominican Republic | 0.0 /100 | #336 | Tragic 86.9% |
| Immigrants | Honduras | 0.0 /100 | #337 | Tragic 86.9% |
| Immigrants | Latin America | 0.0 /100 | #338 | Tragic 86.8% |
| Guatemalans | 0.0 /100 | #339 | Tragic 86.4% |
| Salvadorans | 0.0 /100 | #340 | Tragic 86.2% |
| Mexicans | 0.0 /100 | #341 | Tragic 86.1% |
| Immigrants | Guatemala | 0.0 /100 | #342 | Tragic 85.8% |
| Immigrants | El Salvador | 0.0 /100 | #343 | Tragic 85.3% |
Demographics Similar to Immigrants from Western Europe by 11th Grade
In terms of 11th grade, the demographic groups most similar to Immigrants from Western Europe are Immigrants from South Central Asia (93.6%, a difference of 0.0%), Cambodian (93.6%, a difference of 0.0%), Burmese (93.6%, a difference of 0.0%), Immigrants from Switzerland (93.6%, a difference of 0.010%), and Ottawa (93.6%, a difference of 0.010%).
| Demographics | Rating | Rank | 11th Grade |
| Canadians | 99.5 /100 | #80 | Exceptional 93.7% |
| Immigrants | Moldova | 99.5 /100 | #81 | Exceptional 93.7% |
| Immigrants | Saudi Arabia | 99.3 /100 | #82 | Exceptional 93.7% |
| Icelanders | 99.3 /100 | #83 | Exceptional 93.6% |
| Immigrants | Taiwan | 99.3 /100 | #84 | Exceptional 93.6% |
| Immigrants | Switzerland | 99.3 /100 | #85 | Exceptional 93.6% |
| Immigrants | South Central Asia | 99.2 /100 | #86 | Exceptional 93.6% |
| Immigrants | Western Europe | 99.2 /100 | #87 | Exceptional 93.6% |
| Cambodians | 99.2 /100 | #88 | Exceptional 93.6% |
| Burmese | 99.2 /100 | #89 | Exceptional 93.6% |
| Ottawa | 99.2 /100 | #90 | Exceptional 93.6% |
| South Africans | 99.2 /100 | #91 | Exceptional 93.6% |
| Immigrants | Bulgaria | 99.1 /100 | #92 | Exceptional 93.6% |
| Puget Sound Salish | 99.1 /100 | #93 | Exceptional 93.6% |
| Swiss | 99.0 /100 | #94 | Exceptional 93.6% |