Immigrants from Dominica vs Central American 6th Grade
COMPARE
Immigrants from Dominica
Central American
6th Grade
6th Grade Comparison
Immigrants from Dominica
Central Americans
95.7%
6TH GRADE
0.0/ 100
METRIC RATING
300th/ 347
METRIC RANK
94.5%
6TH GRADE
0.0/ 100
METRIC RATING
337th/ 347
METRIC RANK
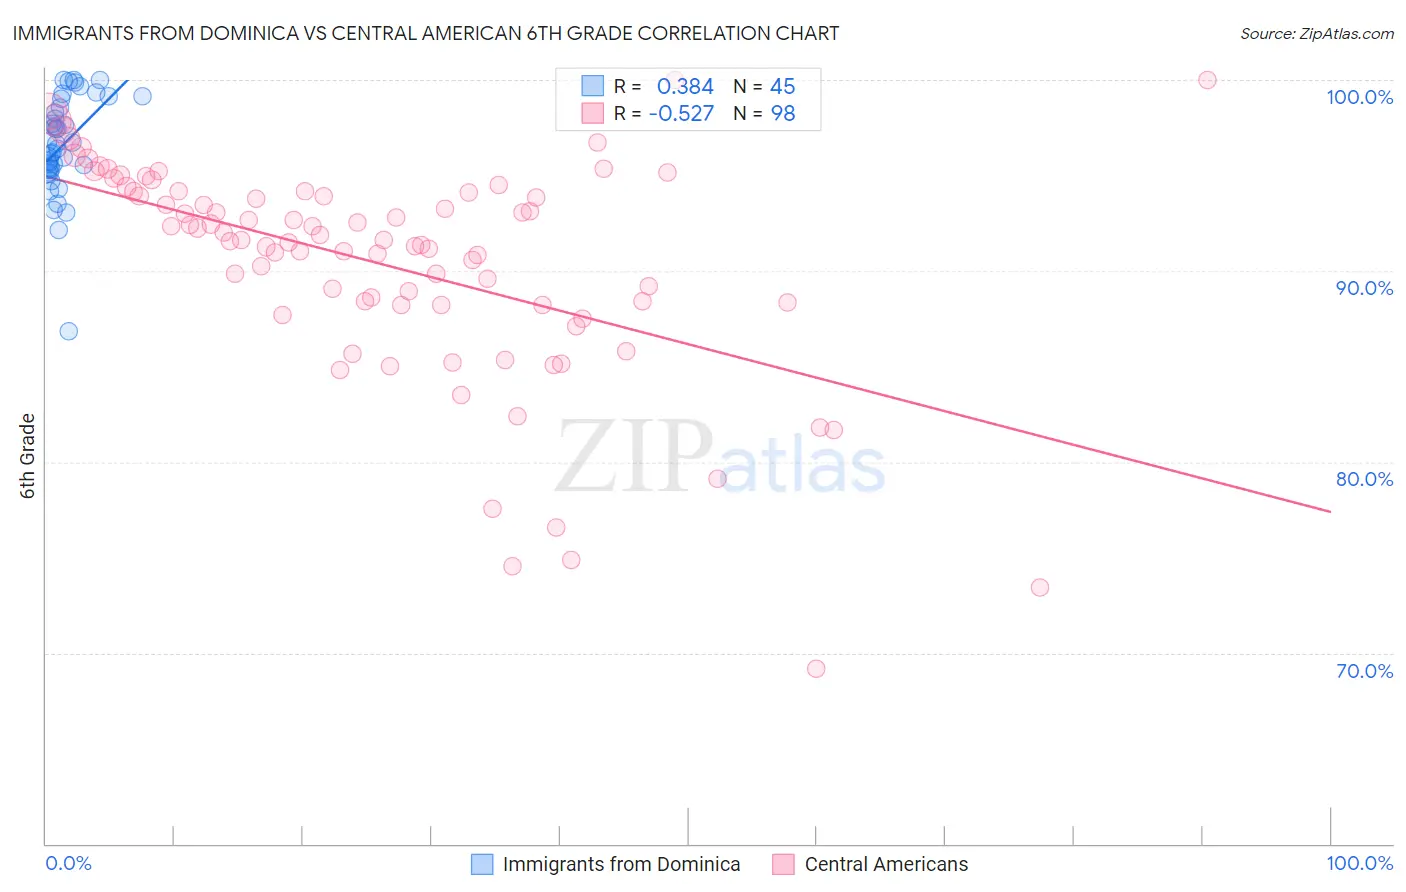
Immigrants from Dominica vs Central American 6th Grade Correlation Chart
The statistical analysis conducted on geographies consisting of 83,794,115 people shows a mild positive correlation between the proportion of Immigrants from Dominica and percentage of population with at least 6th grade education in the United States with a correlation coefficient (R) of 0.384 and weighted average of 95.7%. Similarly, the statistical analysis conducted on geographies consisting of 504,619,198 people shows a substantial negative correlation between the proportion of Central Americans and percentage of population with at least 6th grade education in the United States with a correlation coefficient (R) of -0.527 and weighted average of 94.5%, a difference of 1.4%.
6th Grade Correlation Summary
| Measurement | Immigrants from Dominica | Central American |
| Minimum | 86.8% | 69.2% |
| Maximum | 100.0% | 100.0% |
| Range | 13.2% | 30.8% |
| Mean | 96.6% | 90.4% |
| Median | 96.7% | 91.6% |
| Interquartile 25% (IQ1) | 95.3% | 88.2% |
| Interquartile 75% (IQ3) | 98.8% | 94.1% |
| Interquartile Range (IQR) | 3.5% | 5.9% |
| Standard Deviation (Sample) | 2.6% | 5.8% |
| Standard Deviation (Population) | 2.5% | 5.8% |
Similar Demographics by 6th Grade
Demographics Similar to Immigrants from Dominica by 6th Grade
In terms of 6th grade, the demographic groups most similar to Immigrants from Dominica are Immigrants from Laos (95.7%, a difference of 0.010%), Immigrants (95.7%, a difference of 0.010%), Immigrants from Burma/Myanmar (95.7%, a difference of 0.020%), Sri Lankan (95.8%, a difference of 0.030%), and Haitian (95.8%, a difference of 0.090%).
| Demographics | Rating | Rank | 6th Grade |
| Immigrants | West Indies | 0.0 /100 | #293 | Tragic 96.1% |
| British West Indians | 0.0 /100 | #294 | Tragic 96.0% |
| Immigrants | Grenada | 0.0 /100 | #295 | Tragic 95.9% |
| Immigrants | South Eastern Asia | 0.0 /100 | #296 | Tragic 95.9% |
| Haitians | 0.0 /100 | #297 | Tragic 95.8% |
| Sri Lankans | 0.0 /100 | #298 | Tragic 95.8% |
| Immigrants | Laos | 0.0 /100 | #299 | Tragic 95.7% |
| Immigrants | Dominica | 0.0 /100 | #300 | Tragic 95.7% |
| Immigrants | Immigrants | 0.0 /100 | #301 | Tragic 95.7% |
| Immigrants | Burma/Myanmar | 0.0 /100 | #302 | Tragic 95.7% |
| Bangladeshis | 0.0 /100 | #303 | Tragic 95.7% |
| Indonesians | 0.0 /100 | #304 | Tragic 95.6% |
| Immigrants | Cuba | 0.0 /100 | #305 | Tragic 95.6% |
| Immigrants | Haiti | 0.0 /100 | #306 | Tragic 95.6% |
| Guyanese | 0.0 /100 | #307 | Tragic 95.6% |
Demographics Similar to Central Americans by 6th Grade
In terms of 6th grade, the demographic groups most similar to Central Americans are Immigrants from Cabo Verde (94.4%, a difference of 0.010%), Yakama (94.3%, a difference of 0.15%), Immigrants from Dominican Republic (94.6%, a difference of 0.18%), Mexican (94.6%, a difference of 0.20%), and Immigrants from the Azores (94.7%, a difference of 0.22%).
| Demographics | Rating | Rank | 6th Grade |
| Nepalese | 0.0 /100 | #330 | Tragic 94.9% |
| Immigrants | Armenia | 0.0 /100 | #331 | Tragic 94.9% |
| Immigrants | Honduras | 0.0 /100 | #332 | Tragic 94.8% |
| Immigrants | Latin America | 0.0 /100 | #333 | Tragic 94.7% |
| Immigrants | Azores | 0.0 /100 | #334 | Tragic 94.7% |
| Mexicans | 0.0 /100 | #335 | Tragic 94.6% |
| Immigrants | Dominican Republic | 0.0 /100 | #336 | Tragic 94.6% |
| Central Americans | 0.0 /100 | #337 | Tragic 94.5% |
| Immigrants | Cabo Verde | 0.0 /100 | #338 | Tragic 94.4% |
| Yakama | 0.0 /100 | #339 | Tragic 94.3% |
| Guatemalans | 0.0 /100 | #340 | Tragic 94.2% |
| Immigrants | Yemen | 0.0 /100 | #341 | Tragic 94.1% |
| Immigrants | Central America | 0.0 /100 | #342 | Tragic 94.0% |
| Immigrants | Mexico | 0.0 /100 | #343 | Tragic 93.9% |
| Immigrants | Guatemala | 0.0 /100 | #344 | Tragic 93.9% |