Immigrants from Denmark vs Yup'ik Master's Degree
COMPARE
Immigrants from Denmark
Yup'ik
Master's Degree
Master's Degree Comparison
Immigrants from Denmark
Yup'ik
19.5%
MASTER'S DEGREE
100.0/ 100
METRIC RATING
34th/ 347
METRIC RANK
8.5%
MASTER'S DEGREE
0.0/ 100
METRIC RATING
346th/ 347
METRIC RANK
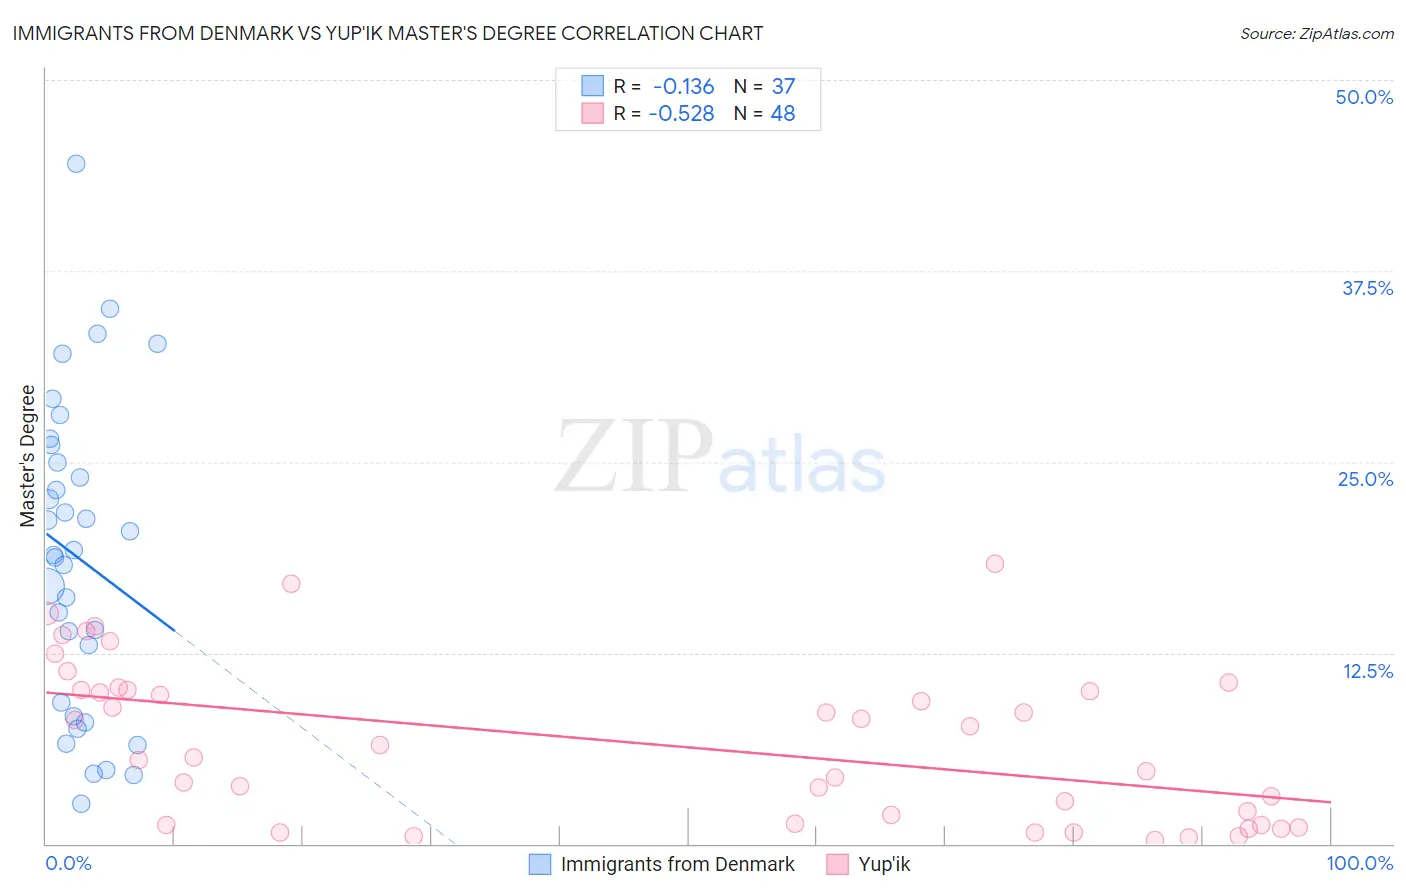
Immigrants from Denmark vs Yup'ik Master's Degree Correlation Chart
The statistical analysis conducted on geographies consisting of 136,426,829 people shows a poor negative correlation between the proportion of Immigrants from Denmark and percentage of population with at least master's degree education in the United States with a correlation coefficient (R) of -0.136 and weighted average of 19.5%. Similarly, the statistical analysis conducted on geographies consisting of 39,946,967 people shows a substantial negative correlation between the proportion of Yup'ik and percentage of population with at least master's degree education in the United States with a correlation coefficient (R) of -0.528 and weighted average of 8.5%, a difference of 128.6%.
Master's Degree Correlation Summary
| Measurement | Immigrants from Denmark | Yup'ik |
| Minimum | 2.7% | 0.21% |
| Maximum | 44.5% | 18.4% |
| Range | 41.9% | 18.1% |
| Mean | 18.7% | 6.6% |
| Median | 18.9% | 6.1% |
| Interquartile 25% (IQ1) | 8.8% | 1.3% |
| Interquartile 75% (IQ3) | 25.5% | 10.1% |
| Interquartile Range (IQR) | 16.7% | 8.8% |
| Standard Deviation (Sample) | 10.1% | 5.1% |
| Standard Deviation (Population) | 9.9% | 5.1% |
Similar Demographics by Master's Degree
Demographics Similar to Immigrants from Denmark by Master's Degree
In terms of master's degree, the demographic groups most similar to Immigrants from Denmark are Russian (19.5%, a difference of 0.030%), Immigrants from Northern Europe (19.5%, a difference of 0.33%), Immigrants from Russia (19.4%, a difference of 0.70%), Mongolian (19.4%, a difference of 0.74%), and Burmese (19.7%, a difference of 0.81%).
| Demographics | Rating | Rank | Master's Degree |
| Immigrants | Sri Lanka | 100.0 /100 | #27 | Exceptional 19.9% |
| Turks | 100.0 /100 | #28 | Exceptional 19.9% |
| Latvians | 100.0 /100 | #29 | Exceptional 19.8% |
| Immigrants | Turkey | 100.0 /100 | #30 | Exceptional 19.7% |
| Immigrants | Korea | 100.0 /100 | #31 | Exceptional 19.7% |
| Burmese | 100.0 /100 | #32 | Exceptional 19.7% |
| Russians | 100.0 /100 | #33 | Exceptional 19.5% |
| Immigrants | Denmark | 100.0 /100 | #34 | Exceptional 19.5% |
| Immigrants | Northern Europe | 100.0 /100 | #35 | Exceptional 19.5% |
| Immigrants | Russia | 100.0 /100 | #36 | Exceptional 19.4% |
| Mongolians | 100.0 /100 | #37 | Exceptional 19.4% |
| Bolivians | 100.0 /100 | #38 | Exceptional 19.3% |
| Immigrants | Spain | 100.0 /100 | #39 | Exceptional 19.1% |
| Immigrants | Bolivia | 100.0 /100 | #40 | Exceptional 19.1% |
| Immigrants | Latvia | 100.0 /100 | #41 | Exceptional 19.1% |
Demographics Similar to Yup'ik by Master's Degree
In terms of master's degree, the demographic groups most similar to Yup'ik are Houma (7.9%, a difference of 8.0%), Yuman (9.2%, a difference of 8.0%), Pima (9.2%, a difference of 8.2%), Lumbee (9.3%, a difference of 8.4%), and Immigrants from Mexico (9.3%, a difference of 8.9%).
| Demographics | Rating | Rank | Master's Degree |
| Menominee | 0.0 /100 | #333 | Tragic 10.2% |
| Arapaho | 0.0 /100 | #334 | Tragic 10.0% |
| Immigrants | Central America | 0.0 /100 | #335 | Tragic 10.0% |
| Natives/Alaskans | 0.0 /100 | #336 | Tragic 9.9% |
| Mexicans | 0.0 /100 | #337 | Tragic 9.7% |
| Tohono O'odham | 0.0 /100 | #338 | Tragic 9.7% |
| Spanish American Indians | 0.0 /100 | #339 | Tragic 9.6% |
| Yakama | 0.0 /100 | #340 | Tragic 9.5% |
| Navajo | 0.0 /100 | #341 | Tragic 9.4% |
| Immigrants | Mexico | 0.0 /100 | #342 | Tragic 9.3% |
| Lumbee | 0.0 /100 | #343 | Tragic 9.3% |
| Pima | 0.0 /100 | #344 | Tragic 9.2% |
| Yuman | 0.0 /100 | #345 | Tragic 9.2% |
| Yup'ik | 0.0 /100 | #346 | Tragic 8.5% |
| Houma | 0.0 /100 | #347 | Tragic 7.9% |