Immigrants from Denmark vs New Zealander 2nd Grade
COMPARE
Immigrants from Denmark
New Zealander
2nd Grade
2nd Grade Comparison
Immigrants from Denmark
New Zealanders
98.2%
2ND GRADE
99.0/ 100
METRIC RATING
87th/ 347
METRIC RANK
98.3%
2ND GRADE
99.7/ 100
METRIC RATING
65th/ 347
METRIC RANK
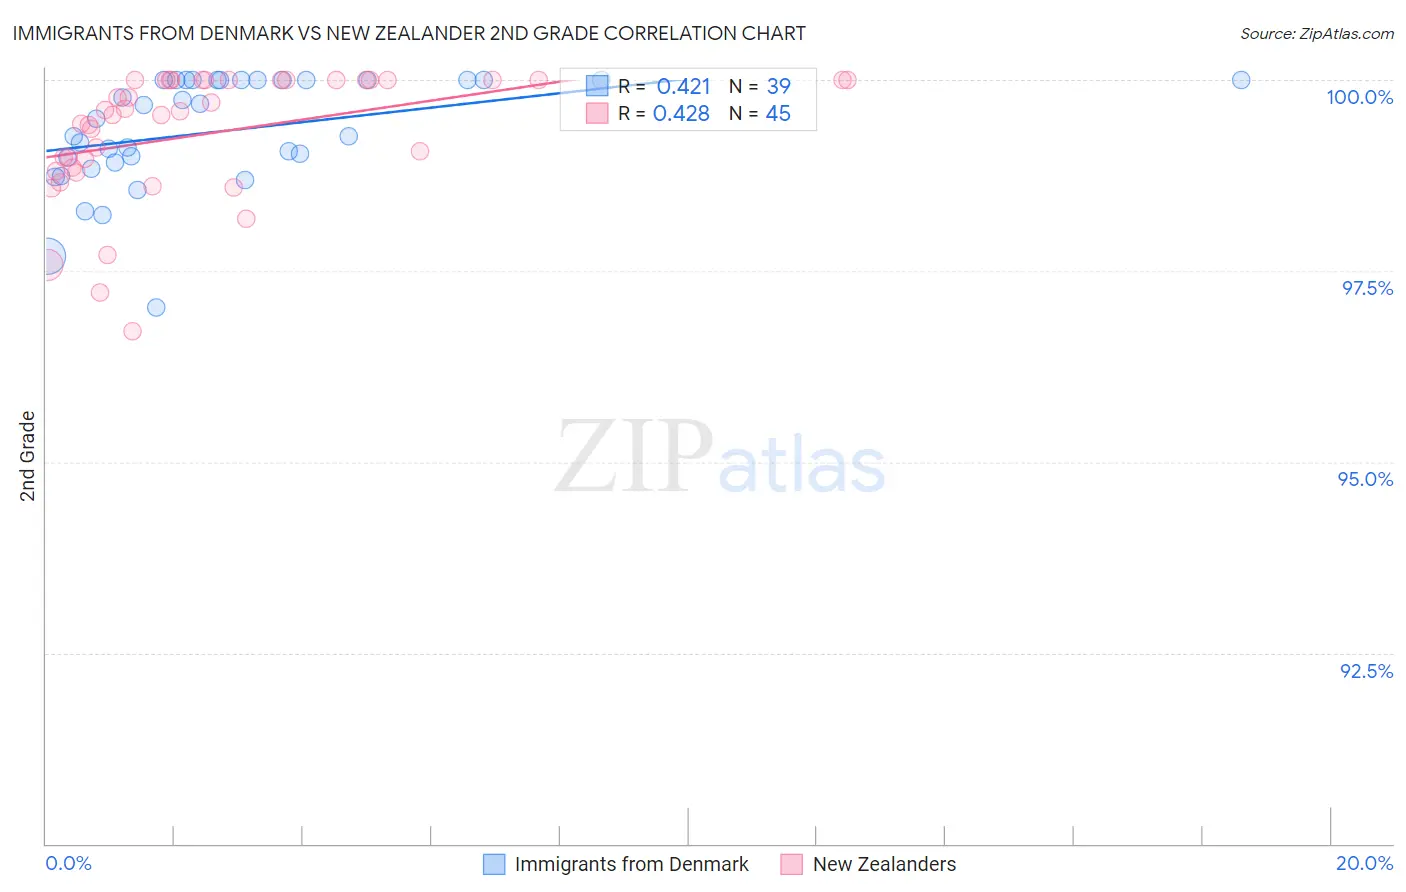
Immigrants from Denmark vs New Zealander 2nd Grade Correlation Chart
The statistical analysis conducted on geographies consisting of 136,428,049 people shows a moderate positive correlation between the proportion of Immigrants from Denmark and percentage of population with at least 2nd grade education in the United States with a correlation coefficient (R) of 0.421 and weighted average of 98.2%. Similarly, the statistical analysis conducted on geographies consisting of 106,918,889 people shows a moderate positive correlation between the proportion of New Zealanders and percentage of population with at least 2nd grade education in the United States with a correlation coefficient (R) of 0.428 and weighted average of 98.3%, a difference of 0.10%.
2nd Grade Correlation Summary
| Measurement | Immigrants from Denmark | New Zealander |
| Minimum | 97.0% | 96.7% |
| Maximum | 100.0% | 100.0% |
| Range | 3.0% | 3.3% |
| Mean | 99.3% | 99.3% |
| Median | 99.5% | 99.6% |
| Interquartile 25% (IQ1) | 98.9% | 98.8% |
| Interquartile 75% (IQ3) | 100.0% | 100.0% |
| Interquartile Range (IQR) | 1.1% | 1.2% |
| Standard Deviation (Sample) | 0.73% | 0.83% |
| Standard Deviation (Population) | 0.72% | 0.82% |
Similar Demographics by 2nd Grade
Demographics Similar to Immigrants from Denmark by 2nd Grade
In terms of 2nd grade, the demographic groups most similar to Immigrants from Denmark are Potawatomi (98.2%, a difference of 0.0%), Immigrants from Australia (98.2%, a difference of 0.0%), Macedonian (98.2%, a difference of 0.0%), Icelander (98.2%, a difference of 0.010%), and Delaware (98.2%, a difference of 0.010%).
| Demographics | Rating | Rank | 2nd Grade |
| Osage | 99.2 /100 | #80 | Exceptional 98.2% |
| Icelanders | 99.2 /100 | #81 | Exceptional 98.2% |
| Delaware | 99.1 /100 | #82 | Exceptional 98.2% |
| Immigrants | Sweden | 99.1 /100 | #83 | Exceptional 98.2% |
| Hopi | 99.1 /100 | #84 | Exceptional 98.2% |
| Potawatomi | 99.1 /100 | #85 | Exceptional 98.2% |
| Immigrants | Australia | 99.0 /100 | #86 | Exceptional 98.2% |
| Immigrants | Denmark | 99.0 /100 | #87 | Exceptional 98.2% |
| Macedonians | 99.0 /100 | #88 | Exceptional 98.2% |
| Ukrainians | 98.9 /100 | #89 | Exceptional 98.2% |
| Zimbabweans | 98.8 /100 | #90 | Exceptional 98.2% |
| Immigrants | Western Europe | 98.8 /100 | #91 | Exceptional 98.2% |
| Immigrants | South Africa | 98.8 /100 | #92 | Exceptional 98.2% |
| Immigrants | India | 98.8 /100 | #93 | Exceptional 98.2% |
| Immigrants | Germany | 98.6 /100 | #94 | Exceptional 98.2% |
Demographics Similar to New Zealanders by 2nd Grade
In terms of 2nd grade, the demographic groups most similar to New Zealanders are Slavic (98.3%, a difference of 0.010%), Creek (98.3%, a difference of 0.010%), Immigrants from Canada (98.3%, a difference of 0.010%), Greek (98.3%, a difference of 0.010%), and Maltese (98.3%, a difference of 0.010%).
| Demographics | Rating | Rank | 2nd Grade |
| Bulgarians | 99.8 /100 | #58 | Exceptional 98.3% |
| Slavs | 99.8 /100 | #59 | Exceptional 98.3% |
| Creek | 99.8 /100 | #60 | Exceptional 98.3% |
| Immigrants | Canada | 99.8 /100 | #61 | Exceptional 98.3% |
| Greeks | 99.8 /100 | #62 | Exceptional 98.3% |
| Maltese | 99.7 /100 | #63 | Exceptional 98.3% |
| Immigrants | North America | 99.7 /100 | #64 | Exceptional 98.3% |
| New Zealanders | 99.7 /100 | #65 | Exceptional 98.3% |
| Canadians | 99.7 /100 | #66 | Exceptional 98.3% |
| Immigrants | Northern Europe | 99.7 /100 | #67 | Exceptional 98.3% |
| Russians | 99.7 /100 | #68 | Exceptional 98.3% |
| Immigrants | Austria | 99.6 /100 | #69 | Exceptional 98.3% |
| Serbians | 99.6 /100 | #70 | Exceptional 98.3% |
| Chickasaw | 99.6 /100 | #71 | Exceptional 98.3% |
| Cheyenne | 99.6 /100 | #72 | Exceptional 98.3% |