Immigrants from Denmark vs Malaysian 4th Grade
COMPARE
Immigrants from Denmark
Malaysian
4th Grade
4th Grade Comparison
Immigrants from Denmark
Malaysians
97.9%
4TH GRADE
98.7/ 100
METRIC RATING
90th/ 347
METRIC RANK
96.7%
4TH GRADE
0.0/ 100
METRIC RATING
292nd/ 347
METRIC RANK
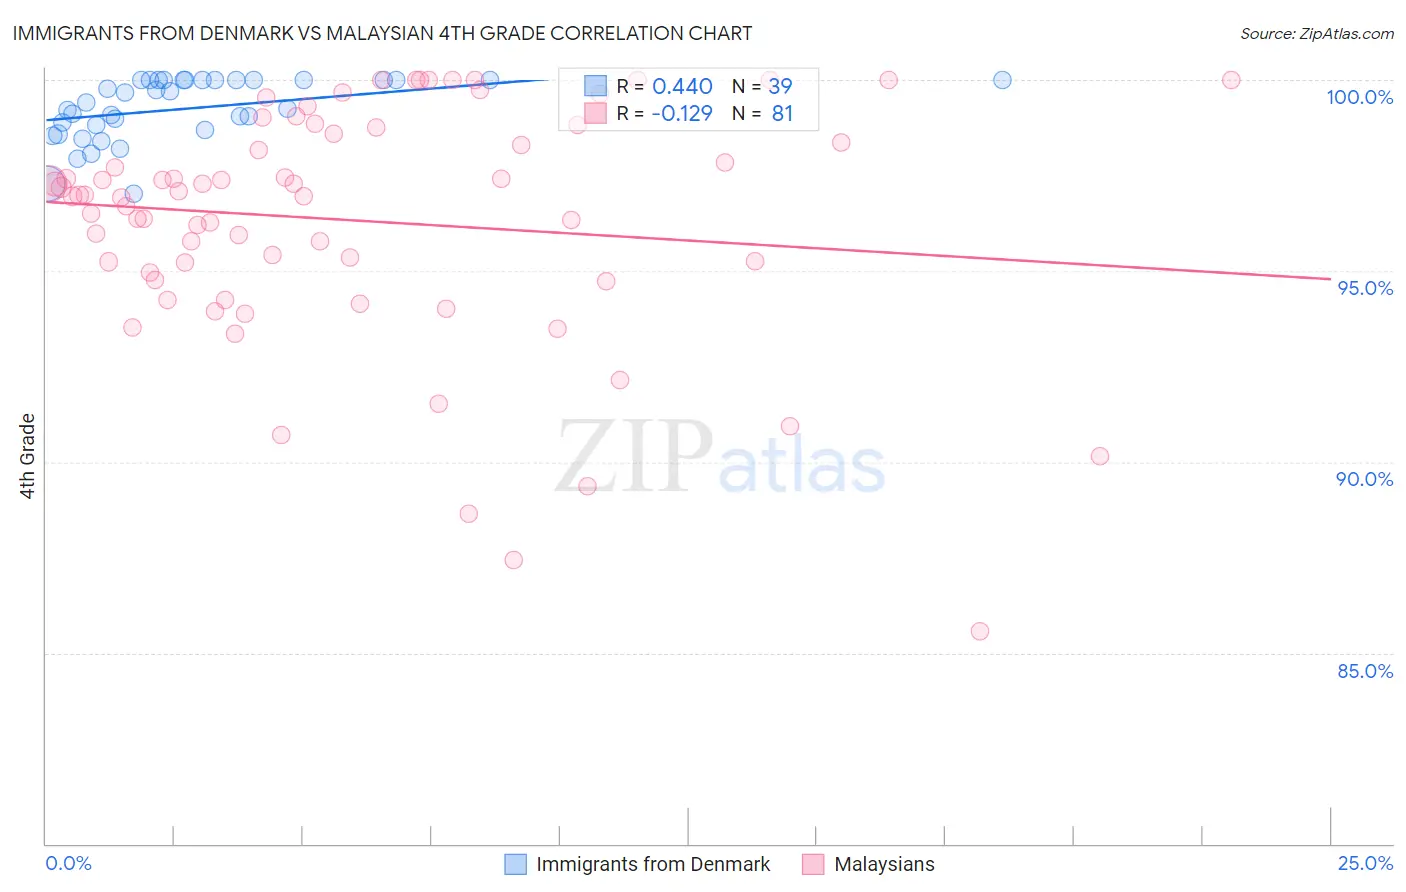
Immigrants from Denmark vs Malaysian 4th Grade Correlation Chart
The statistical analysis conducted on geographies consisting of 136,428,049 people shows a moderate positive correlation between the proportion of Immigrants from Denmark and percentage of population with at least 4th grade education in the United States with a correlation coefficient (R) of 0.440 and weighted average of 97.9%. Similarly, the statistical analysis conducted on geographies consisting of 226,107,000 people shows a poor negative correlation between the proportion of Malaysians and percentage of population with at least 4th grade education in the United States with a correlation coefficient (R) of -0.129 and weighted average of 96.7%, a difference of 1.3%.
4th Grade Correlation Summary
| Measurement | Immigrants from Denmark | Malaysian |
| Minimum | 97.0% | 85.6% |
| Maximum | 100.0% | 100.0% |
| Range | 3.0% | 14.4% |
| Mean | 99.3% | 96.3% |
| Median | 99.4% | 97.0% |
| Interquartile 25% (IQ1) | 98.7% | 94.9% |
| Interquartile 75% (IQ3) | 100.0% | 98.7% |
| Interquartile Range (IQR) | 1.3% | 3.8% |
| Standard Deviation (Sample) | 0.82% | 3.1% |
| Standard Deviation (Population) | 0.81% | 3.1% |
Similar Demographics by 4th Grade
Demographics Similar to Immigrants from Denmark by 4th Grade
In terms of 4th grade, the demographic groups most similar to Immigrants from Denmark are Zimbabwean (97.9%, a difference of 0.0%), Immigrants from South Africa (97.9%, a difference of 0.0%), Delaware (97.9%, a difference of 0.0%), Immigrants from Sweden (97.9%, a difference of 0.0%), and Immigrants from Western Europe (97.9%, a difference of 0.0%).
| Demographics | Rating | Rank | 4th Grade |
| Immigrants | Belgium | 99.0 /100 | #83 | Exceptional 97.9% |
| Cypriots | 98.9 /100 | #84 | Exceptional 97.9% |
| Potawatomi | 98.9 /100 | #85 | Exceptional 97.9% |
| Immigrants | Australia | 98.8 /100 | #86 | Exceptional 97.9% |
| Zimbabweans | 98.8 /100 | #87 | Exceptional 97.9% |
| Immigrants | South Africa | 98.8 /100 | #88 | Exceptional 97.9% |
| Delaware | 98.8 /100 | #89 | Exceptional 97.9% |
| Immigrants | Denmark | 98.7 /100 | #90 | Exceptional 97.9% |
| Immigrants | Sweden | 98.7 /100 | #91 | Exceptional 97.9% |
| Immigrants | Western Europe | 98.7 /100 | #92 | Exceptional 97.9% |
| Immigrants | Ireland | 98.7 /100 | #93 | Exceptional 97.9% |
| Shoshone | 98.7 /100 | #94 | Exceptional 97.9% |
| Immigrants | Germany | 98.5 /100 | #95 | Exceptional 97.9% |
| Romanians | 98.4 /100 | #96 | Exceptional 97.9% |
| Cheyenne | 98.4 /100 | #97 | Exceptional 97.9% |
Demographics Similar to Malaysians by 4th Grade
In terms of 4th grade, the demographic groups most similar to Malaysians are Immigrants from Grenada (96.7%, a difference of 0.010%), Puerto Rican (96.7%, a difference of 0.020%), British West Indian (96.7%, a difference of 0.040%), Immigrants from Eritrea (96.7%, a difference of 0.040%), and Immigrants from West Indies (96.7%, a difference of 0.050%).
| Demographics | Rating | Rank | 4th Grade |
| Immigrants | Barbados | 0.0 /100 | #285 | Tragic 96.8% |
| Immigrants | Thailand | 0.0 /100 | #286 | Tragic 96.8% |
| Houma | 0.0 /100 | #287 | Tragic 96.8% |
| Immigrants | Afghanistan | 0.0 /100 | #288 | Tragic 96.8% |
| Immigrants | West Indies | 0.0 /100 | #289 | Tragic 96.7% |
| British West Indians | 0.0 /100 | #290 | Tragic 96.7% |
| Immigrants | Grenada | 0.0 /100 | #291 | Tragic 96.7% |
| Malaysians | 0.0 /100 | #292 | Tragic 96.7% |
| Puerto Ricans | 0.0 /100 | #293 | Tragic 96.7% |
| Immigrants | Eritrea | 0.0 /100 | #294 | Tragic 96.7% |
| Immigrants | Portugal | 0.0 /100 | #295 | Tragic 96.6% |
| Somalis | 0.0 /100 | #296 | Tragic 96.6% |
| Immigrants | Somalia | 0.0 /100 | #297 | Tragic 96.5% |
| Haitians | 0.0 /100 | #298 | Tragic 96.5% |
| Immigrants | Dominica | 0.0 /100 | #299 | Tragic 96.5% |