Immigrants from Czechoslovakia vs Immigrants from St. Vincent and the Grenadines 8th Grade
COMPARE
Immigrants from Czechoslovakia
Immigrants from St. Vincent and the Grenadines
8th Grade
8th Grade Comparison
Immigrants from Czechoslovakia
Immigrants from St. Vincent and the Grenadines
96.4%
8TH GRADE
98.6/ 100
METRIC RATING
100th/ 347
METRIC RANK
94.6%
8TH GRADE
0.1/ 100
METRIC RATING
283rd/ 347
METRIC RANK
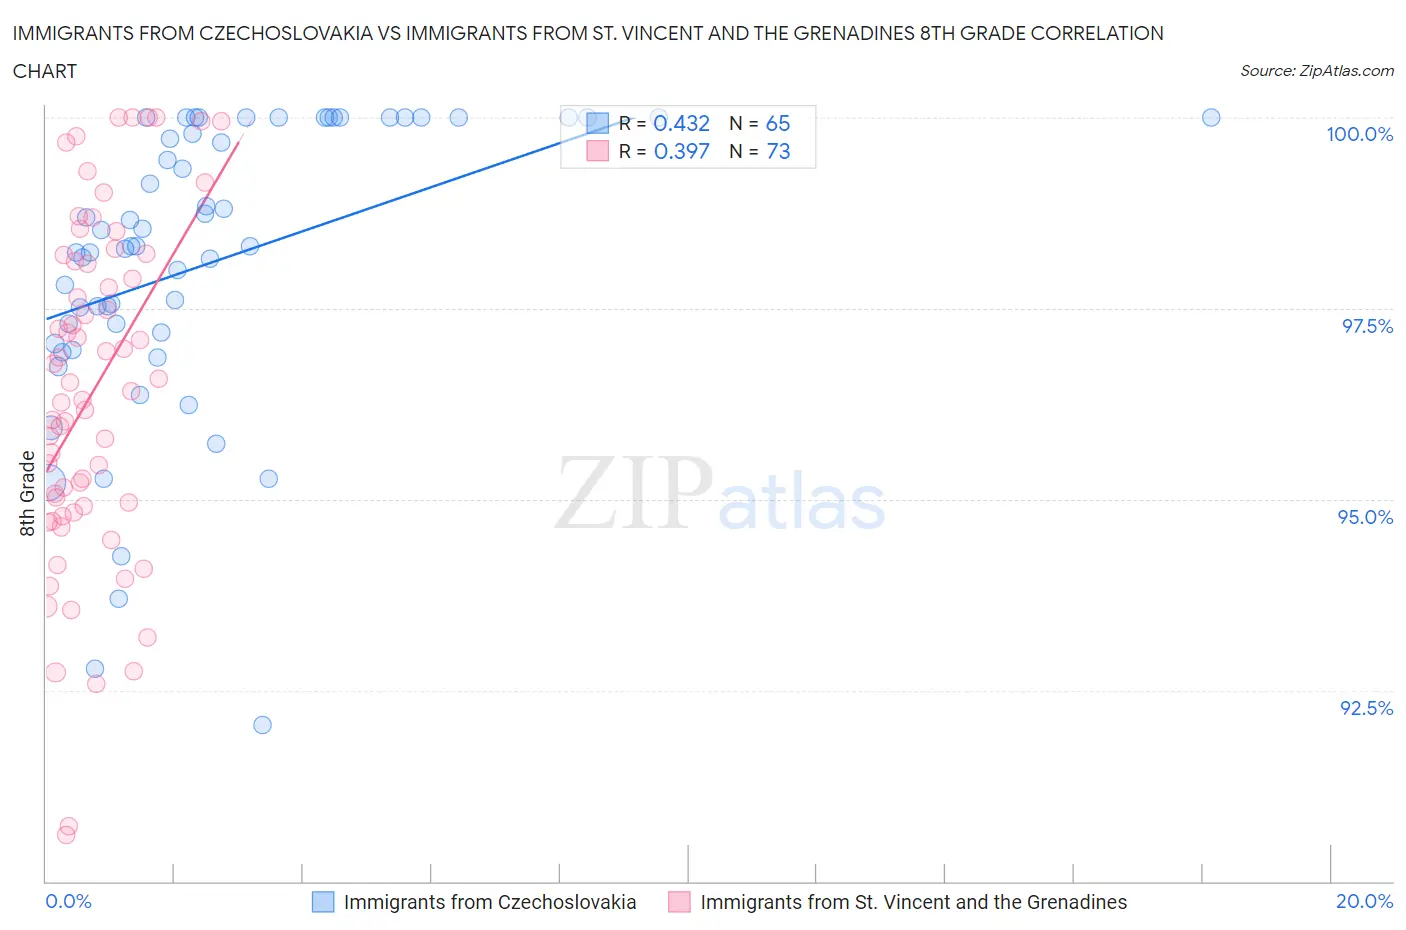
Immigrants from Czechoslovakia vs Immigrants from St. Vincent and the Grenadines 8th Grade Correlation Chart
The statistical analysis conducted on geographies consisting of 195,448,106 people shows a moderate positive correlation between the proportion of Immigrants from Czechoslovakia and percentage of population with at least 8th grade education in the United States with a correlation coefficient (R) of 0.432 and weighted average of 96.4%. Similarly, the statistical analysis conducted on geographies consisting of 56,191,418 people shows a mild positive correlation between the proportion of Immigrants from St. Vincent and the Grenadines and percentage of population with at least 8th grade education in the United States with a correlation coefficient (R) of 0.397 and weighted average of 94.6%, a difference of 1.9%.
8th Grade Correlation Summary
| Measurement | Immigrants from Czechoslovakia | Immigrants from St. Vincent and the Grenadines |
| Minimum | 92.0% | 90.6% |
| Maximum | 100.0% | 100.0% |
| Range | 8.0% | 9.4% |
| Mean | 98.1% | 96.4% |
| Median | 98.3% | 96.4% |
| Interquartile 25% (IQ1) | 97.1% | 94.9% |
| Interquartile 75% (IQ3) | 100.0% | 98.2% |
| Interquartile Range (IQR) | 2.9% | 3.3% |
| Standard Deviation (Sample) | 1.9% | 2.2% |
| Standard Deviation (Population) | 1.9% | 2.2% |
Similar Demographics by 8th Grade
Demographics Similar to Immigrants from Czechoslovakia by 8th Grade
In terms of 8th grade, the demographic groups most similar to Immigrants from Czechoslovakia are Osage (96.4%, a difference of 0.010%), Immigrants from Germany (96.4%, a difference of 0.010%), Cree (96.4%, a difference of 0.010%), German Russian (96.4%, a difference of 0.020%), and Potawatomi (96.4%, a difference of 0.020%).
| Demographics | Rating | Rank | 8th Grade |
| Immigrants | Denmark | 98.8 /100 | #93 | Exceptional 96.4% |
| Immigrants | Singapore | 98.8 /100 | #94 | Exceptional 96.4% |
| German Russians | 98.8 /100 | #95 | Exceptional 96.4% |
| Potawatomi | 98.7 /100 | #96 | Exceptional 96.4% |
| Osage | 98.7 /100 | #97 | Exceptional 96.4% |
| Immigrants | Germany | 98.7 /100 | #98 | Exceptional 96.4% |
| Cree | 98.6 /100 | #99 | Exceptional 96.4% |
| Immigrants | Czechoslovakia | 98.6 /100 | #100 | Exceptional 96.4% |
| Bhutanese | 98.2 /100 | #101 | Exceptional 96.4% |
| South Africans | 98.2 /100 | #102 | Exceptional 96.4% |
| Immigrants | Saudi Arabia | 98.0 /100 | #103 | Exceptional 96.3% |
| Kiowa | 98.0 /100 | #104 | Exceptional 96.3% |
| Immigrants | North Macedonia | 98.0 /100 | #105 | Exceptional 96.3% |
| Okinawans | 98.0 /100 | #106 | Exceptional 96.3% |
| Immigrants | Latvia | 97.8 /100 | #107 | Exceptional 96.3% |
Demographics Similar to Immigrants from St. Vincent and the Grenadines by 8th Grade
In terms of 8th grade, the demographic groups most similar to Immigrants from St. Vincent and the Grenadines are Immigrants from Philippines (94.6%, a difference of 0.010%), Immigrants from Eritrea (94.6%, a difference of 0.030%), Immigrants from Barbados (94.5%, a difference of 0.040%), Barbadian (94.6%, a difference of 0.070%), and Immigrants from Bolivia (94.6%, a difference of 0.070%).
| Demographics | Rating | Rank | 8th Grade |
| Peruvians | 0.1 /100 | #276 | Tragic 94.7% |
| Taiwanese | 0.1 /100 | #277 | Tragic 94.7% |
| Armenians | 0.1 /100 | #278 | Tragic 94.7% |
| Immigrants | Trinidad and Tobago | 0.1 /100 | #279 | Tragic 94.6% |
| Barbadians | 0.1 /100 | #280 | Tragic 94.6% |
| Immigrants | Bolivia | 0.1 /100 | #281 | Tragic 94.6% |
| Immigrants | Eritrea | 0.1 /100 | #282 | Tragic 94.6% |
| Immigrants | St. Vincent and the Grenadines | 0.1 /100 | #283 | Tragic 94.6% |
| Immigrants | Philippines | 0.1 /100 | #284 | Tragic 94.6% |
| Immigrants | Barbados | 0.0 /100 | #285 | Tragic 94.5% |
| Immigrants | Peru | 0.0 /100 | #286 | Tragic 94.5% |
| Tohono O'odham | 0.0 /100 | #287 | Tragic 94.5% |
| Malaysians | 0.0 /100 | #288 | Tragic 94.5% |
| British West Indians | 0.0 /100 | #289 | Tragic 94.4% |
| Immigrants | West Indies | 0.0 /100 | #290 | Tragic 94.3% |