Immigrants from Czechoslovakia vs Immigrants from Kuwait 12th Grade, No Diploma
COMPARE
Immigrants from Czechoslovakia
Immigrants from Kuwait
12th Grade, No Diploma
12th Grade, No Diploma Comparison
Immigrants from Czechoslovakia
Immigrants from Kuwait
92.7%
12TH GRADE, NO DIPLOMA
99.5/ 100
METRIC RATING
68th/ 347
METRIC RANK
92.3%
12TH GRADE, NO DIPLOMA
98.4/ 100
METRIC RATING
98th/ 347
METRIC RANK
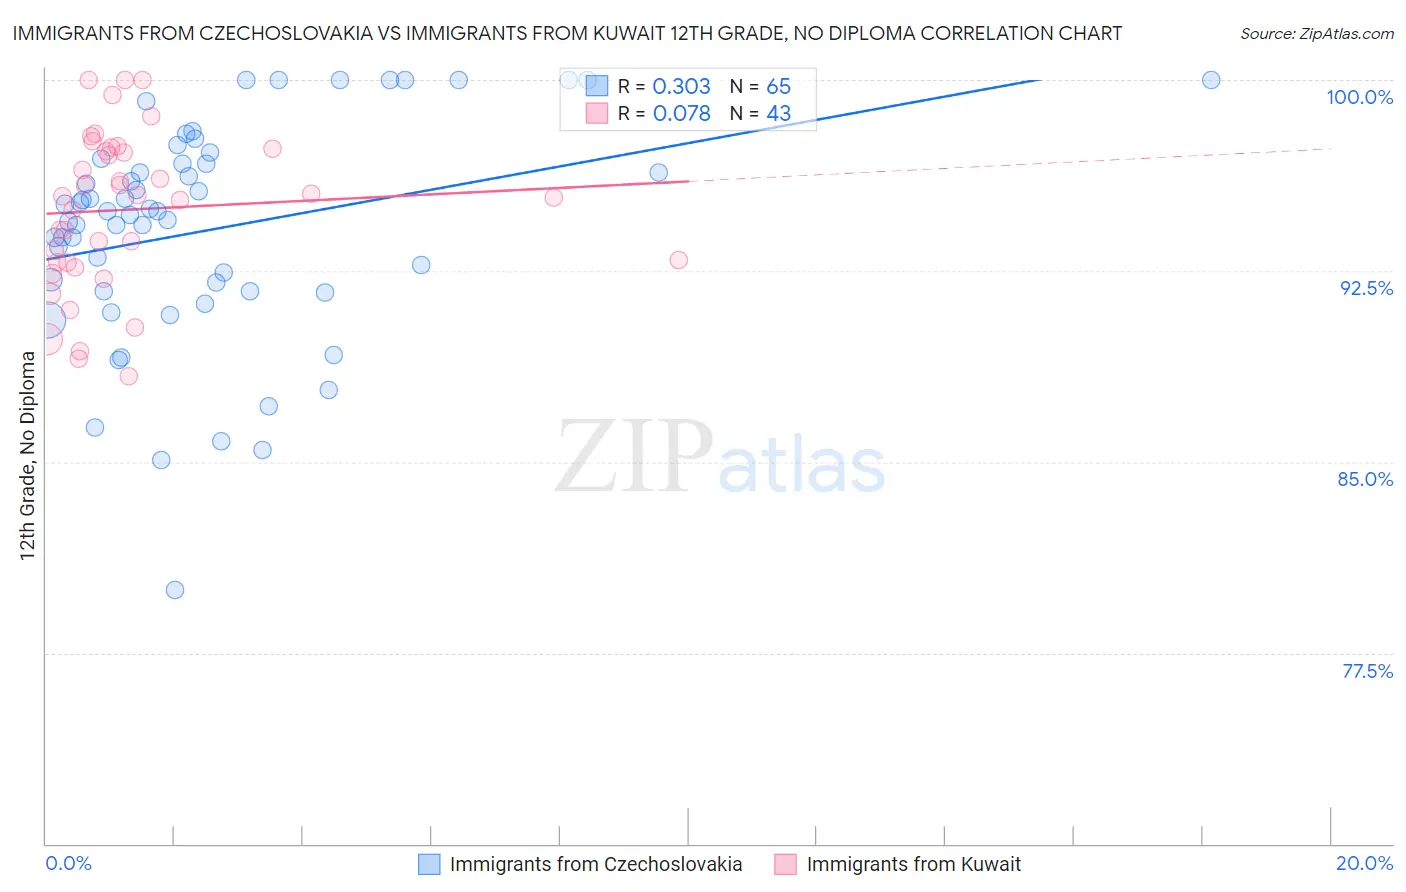
Immigrants from Czechoslovakia vs Immigrants from Kuwait 12th Grade, No Diploma Correlation Chart
The statistical analysis conducted on geographies consisting of 195,448,106 people shows a mild positive correlation between the proportion of Immigrants from Czechoslovakia and percentage of population with at least 12th grade (no diploma) education in the United States with a correlation coefficient (R) of 0.303 and weighted average of 92.7%. Similarly, the statistical analysis conducted on geographies consisting of 136,917,085 people shows a slight positive correlation between the proportion of Immigrants from Kuwait and percentage of population with at least 12th grade (no diploma) education in the United States with a correlation coefficient (R) of 0.078 and weighted average of 92.3%, a difference of 0.36%.
12th Grade, No Diploma Correlation Summary
| Measurement | Immigrants from Czechoslovakia | Immigrants from Kuwait |
| Minimum | 80.0% | 88.4% |
| Maximum | 100.0% | 100.0% |
| Range | 20.0% | 11.6% |
| Mean | 94.1% | 94.9% |
| Median | 94.8% | 95.4% |
| Interquartile 25% (IQ1) | 91.7% | 92.8% |
| Interquartile 75% (IQ3) | 96.8% | 97.3% |
| Interquartile Range (IQR) | 5.1% | 4.5% |
| Standard Deviation (Sample) | 4.3% | 3.1% |
| Standard Deviation (Population) | 4.3% | 3.0% |
Similar Demographics by 12th Grade, No Diploma
Demographics Similar to Immigrants from Czechoslovakia by 12th Grade, No Diploma
In terms of 12th grade, no diploma, the demographic groups most similar to Immigrants from Czechoslovakia are Immigrants from Iran (92.7%, a difference of 0.0%), Immigrants from South Africa (92.7%, a difference of 0.010%), Czechoslovakian (92.6%, a difference of 0.010%), Immigrants from Latvia (92.6%, a difference of 0.020%), and Immigrants from South Central Asia (92.6%, a difference of 0.030%).
| Demographics | Rating | Rank | 12th Grade, No Diploma |
| Immigrants | Japan | 99.7 /100 | #61 | Exceptional 92.8% |
| Ukrainians | 99.6 /100 | #62 | Exceptional 92.7% |
| Zimbabweans | 99.6 /100 | #63 | Exceptional 92.7% |
| Immigrants | Netherlands | 99.6 /100 | #64 | Exceptional 92.7% |
| Austrians | 99.6 /100 | #65 | Exceptional 92.7% |
| Soviet Union | 99.6 /100 | #66 | Exceptional 92.7% |
| Immigrants | South Africa | 99.5 /100 | #67 | Exceptional 92.7% |
| Immigrants | Czechoslovakia | 99.5 /100 | #68 | Exceptional 92.7% |
| Immigrants | Iran | 99.5 /100 | #69 | Exceptional 92.7% |
| Czechoslovakians | 99.5 /100 | #70 | Exceptional 92.6% |
| Immigrants | Latvia | 99.5 /100 | #71 | Exceptional 92.6% |
| Immigrants | South Central Asia | 99.5 /100 | #72 | Exceptional 92.6% |
| Burmese | 99.4 /100 | #73 | Exceptional 92.6% |
| Immigrants | Moldova | 99.4 /100 | #74 | Exceptional 92.6% |
| Native Hawaiians | 99.4 /100 | #75 | Exceptional 92.6% |
Demographics Similar to Immigrants from Kuwait by 12th Grade, No Diploma
In terms of 12th grade, no diploma, the demographic groups most similar to Immigrants from Kuwait are Celtic (92.3%, a difference of 0.0%), Immigrants from Europe (92.3%, a difference of 0.010%), Immigrants from North Macedonia (92.3%, a difference of 0.010%), Icelander (92.3%, a difference of 0.010%), and Immigrants from Korea (92.3%, a difference of 0.020%).
| Demographics | Rating | Rank | 12th Grade, No Diploma |
| South Africans | 98.6 /100 | #91 | Exceptional 92.4% |
| Immigrants | Romania | 98.5 /100 | #92 | Exceptional 92.3% |
| Immigrants | Western Europe | 98.5 /100 | #93 | Exceptional 92.3% |
| Immigrants | Europe | 98.5 /100 | #94 | Exceptional 92.3% |
| Immigrants | North Macedonia | 98.5 /100 | #95 | Exceptional 92.3% |
| Icelanders | 98.5 /100 | #96 | Exceptional 92.3% |
| Celtics | 98.4 /100 | #97 | Exceptional 92.3% |
| Immigrants | Kuwait | 98.4 /100 | #98 | Exceptional 92.3% |
| Immigrants | Korea | 98.3 /100 | #99 | Exceptional 92.3% |
| Immigrants | Croatia | 98.3 /100 | #100 | Exceptional 92.3% |
| Swiss | 98.1 /100 | #101 | Exceptional 92.3% |
| Alaskan Athabascans | 98.1 /100 | #102 | Exceptional 92.3% |
| Immigrants | Norway | 98.1 /100 | #103 | Exceptional 92.3% |
| Lebanese | 97.6 /100 | #104 | Exceptional 92.2% |
| Immigrants | Belarus | 97.4 /100 | #105 | Exceptional 92.2% |