Immigrants from Czechoslovakia vs Bangladeshi 3rd Grade
COMPARE
Immigrants from Czechoslovakia
Bangladeshi
3rd Grade
3rd Grade Comparison
Immigrants from Czechoslovakia
Bangladeshis
98.0%
3RD GRADE
97.0/ 100
METRIC RATING
107th/ 347
METRIC RANK
96.3%
3RD GRADE
0.0/ 100
METRIC RATING
328th/ 347
METRIC RANK
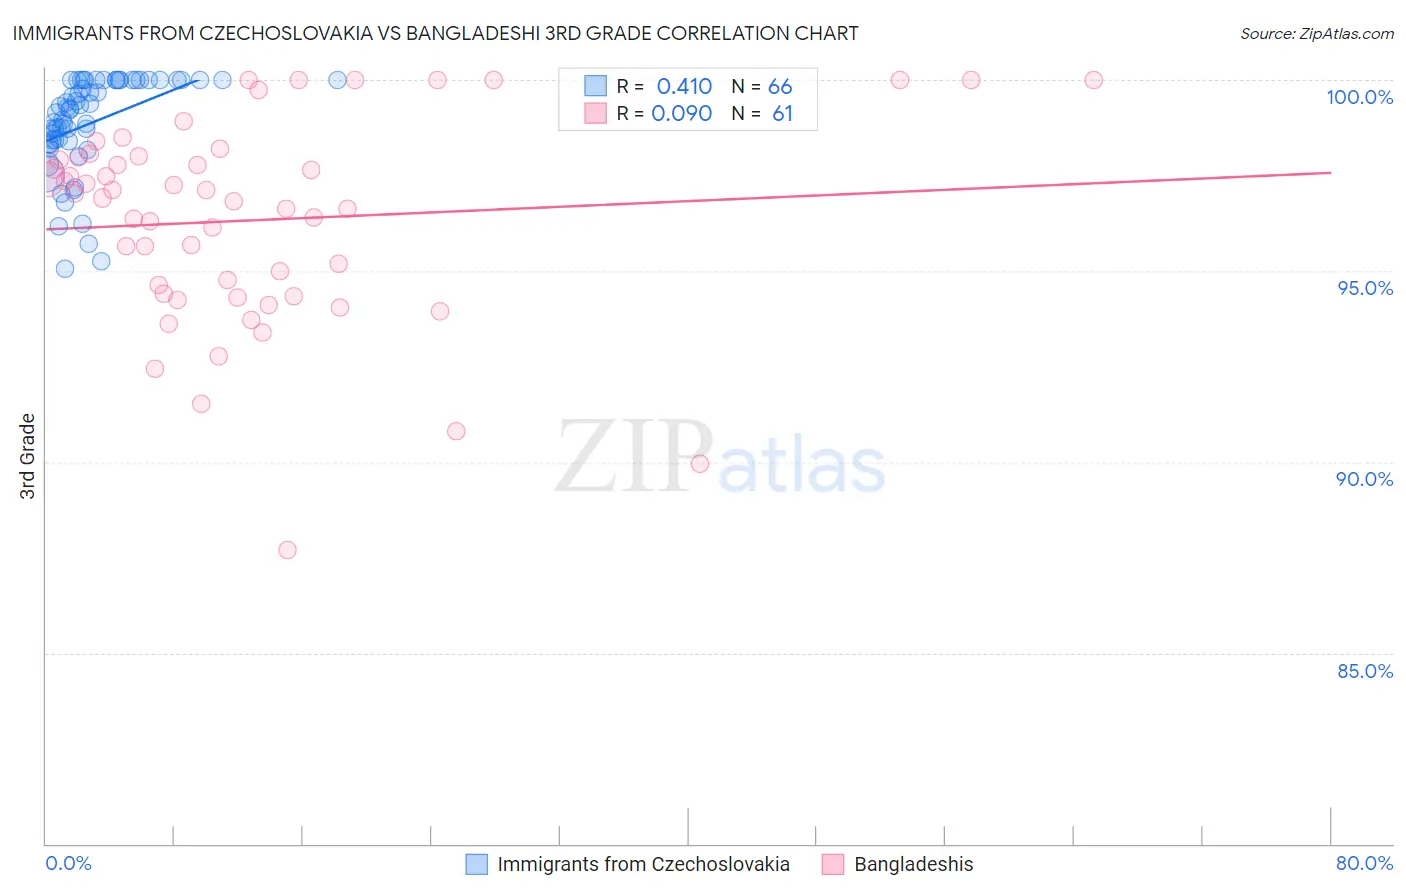
Immigrants from Czechoslovakia vs Bangladeshi 3rd Grade Correlation Chart
The statistical analysis conducted on geographies consisting of 195,448,060 people shows a moderate positive correlation between the proportion of Immigrants from Czechoslovakia and percentage of population with at least 3rd grade education in the United States with a correlation coefficient (R) of 0.410 and weighted average of 98.0%. Similarly, the statistical analysis conducted on geographies consisting of 141,430,495 people shows a slight positive correlation between the proportion of Bangladeshis and percentage of population with at least 3rd grade education in the United States with a correlation coefficient (R) of 0.090 and weighted average of 96.3%, a difference of 1.8%.
3rd Grade Correlation Summary
| Measurement | Immigrants from Czechoslovakia | Bangladeshi |
| Minimum | 95.1% | 87.7% |
| Maximum | 100.0% | 100.0% |
| Range | 4.9% | 12.3% |
| Mean | 98.9% | 96.3% |
| Median | 99.2% | 96.9% |
| Interquartile 25% (IQ1) | 98.4% | 94.4% |
| Interquartile 75% (IQ3) | 100.0% | 98.0% |
| Interquartile Range (IQR) | 1.6% | 3.6% |
| Standard Deviation (Sample) | 1.3% | 2.7% |
| Standard Deviation (Population) | 1.3% | 2.6% |
Similar Demographics by 3rd Grade
Demographics Similar to Immigrants from Czechoslovakia by 3rd Grade
In terms of 3rd grade, the demographic groups most similar to Immigrants from Czechoslovakia are German Russian (98.1%, a difference of 0.010%), Bhutanese (98.1%, a difference of 0.010%), Immigrants from Singapore (98.0%, a difference of 0.010%), Pima (98.0%, a difference of 0.010%), and Immigrants from Switzerland (98.0%, a difference of 0.010%).
| Demographics | Rating | Rank | 3rd Grade |
| Cree | 97.9 /100 | #100 | Exceptional 98.1% |
| Puget Sound Salish | 97.9 /100 | #101 | Exceptional 98.1% |
| Immigrants | Nonimmigrants | 97.8 /100 | #102 | Exceptional 98.1% |
| Yugoslavians | 97.7 /100 | #103 | Exceptional 98.1% |
| Turks | 97.6 /100 | #104 | Exceptional 98.1% |
| German Russians | 97.2 /100 | #105 | Exceptional 98.1% |
| Bhutanese | 97.2 /100 | #106 | Exceptional 98.1% |
| Immigrants | Czechoslovakia | 97.0 /100 | #107 | Exceptional 98.0% |
| Immigrants | Singapore | 96.7 /100 | #108 | Exceptional 98.0% |
| Pima | 96.7 /100 | #109 | Exceptional 98.0% |
| Immigrants | Switzerland | 96.6 /100 | #110 | Exceptional 98.0% |
| Basques | 96.5 /100 | #111 | Exceptional 98.0% |
| Immigrants | Latvia | 96.0 /100 | #112 | Exceptional 98.0% |
| Thais | 95.5 /100 | #113 | Exceptional 98.0% |
| Menominee | 95.4 /100 | #114 | Exceptional 98.0% |
Demographics Similar to Bangladeshis by 3rd Grade
In terms of 3rd grade, the demographic groups most similar to Bangladeshis are Immigrants from Vietnam (96.4%, a difference of 0.010%), Japanese (96.4%, a difference of 0.010%), Immigrants from Honduras (96.3%, a difference of 0.020%), Mexican American Indian (96.4%, a difference of 0.050%), and Dominican (96.4%, a difference of 0.060%).
| Demographics | Rating | Rank | 3rd Grade |
| Indonesians | 0.0 /100 | #321 | Tragic 96.5% |
| Immigrants | Belize | 0.0 /100 | #322 | Tragic 96.5% |
| Hondurans | 0.0 /100 | #323 | Tragic 96.5% |
| Dominicans | 0.0 /100 | #324 | Tragic 96.4% |
| Mexican American Indians | 0.0 /100 | #325 | Tragic 96.4% |
| Immigrants | Vietnam | 0.0 /100 | #326 | Tragic 96.4% |
| Japanese | 0.0 /100 | #327 | Tragic 96.4% |
| Bangladeshis | 0.0 /100 | #328 | Tragic 96.3% |
| Immigrants | Honduras | 0.0 /100 | #329 | Tragic 96.3% |
| Immigrants | Armenia | 0.0 /100 | #330 | Tragic 96.3% |
| Immigrants | Latin America | 0.0 /100 | #331 | Tragic 96.2% |
| Mexicans | 0.0 /100 | #332 | Tragic 96.2% |
| Immigrants | Fiji | 0.0 /100 | #333 | Tragic 96.2% |
| Immigrants | Cambodia | 0.0 /100 | #334 | Tragic 96.2% |
| Immigrants | Dominican Republic | 0.0 /100 | #335 | Tragic 96.2% |