Immigrants from Czechoslovakia vs Argentinean 11th Grade
COMPARE
Immigrants from Czechoslovakia
Argentinean
11th Grade
11th Grade Comparison
Immigrants from Czechoslovakia
Argentineans
93.8%
11TH GRADE
99.6/ 100
METRIC RATING
74th/ 347
METRIC RANK
92.7%
11TH GRADE
73.4/ 100
METRIC RATING
155th/ 347
METRIC RANK
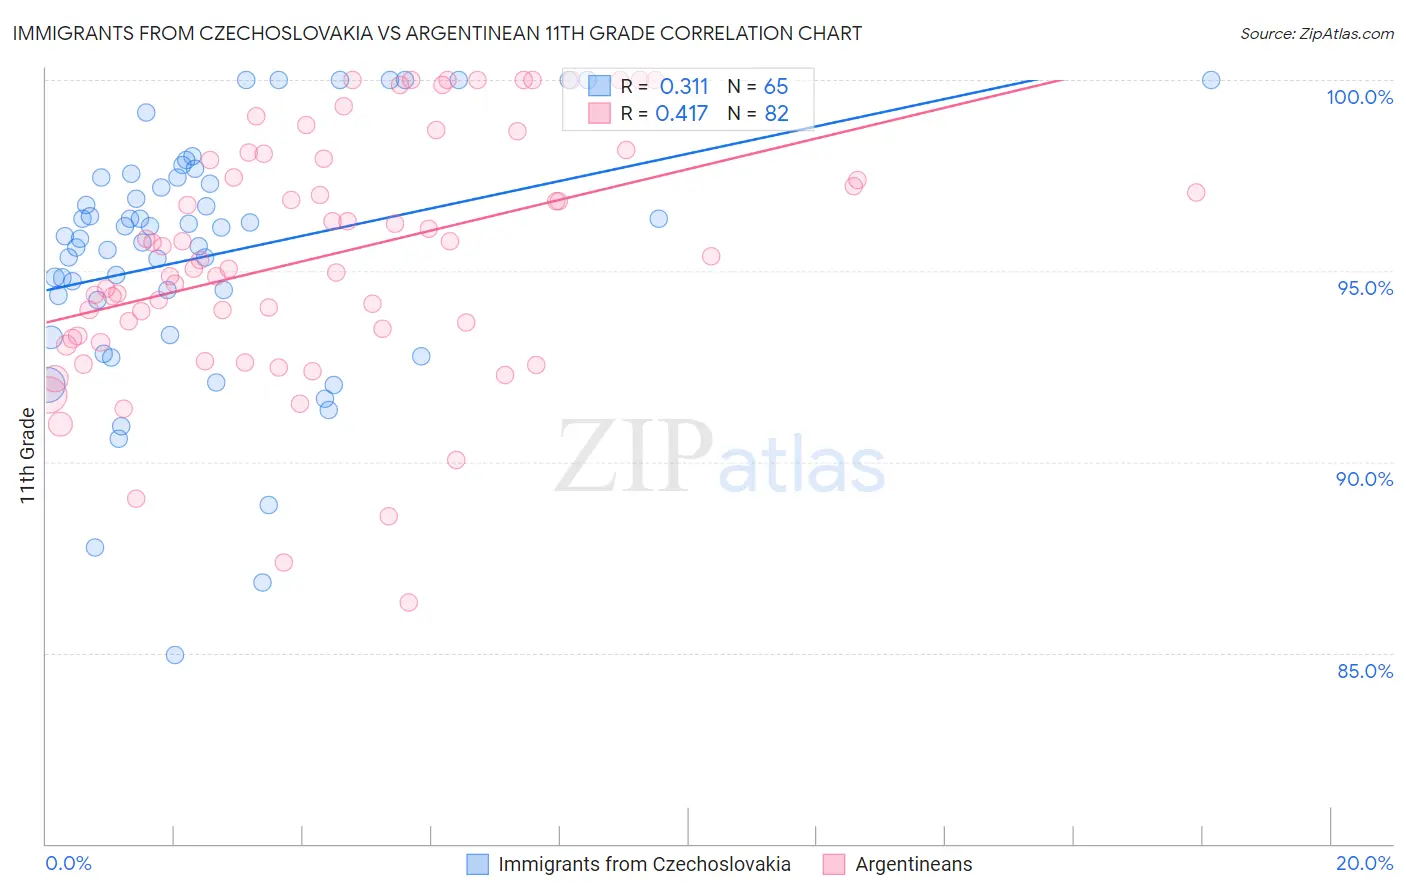
Immigrants from Czechoslovakia vs Argentinean 11th Grade Correlation Chart
The statistical analysis conducted on geographies consisting of 195,448,106 people shows a mild positive correlation between the proportion of Immigrants from Czechoslovakia and percentage of population with at least 11th grade education in the United States with a correlation coefficient (R) of 0.311 and weighted average of 93.8%. Similarly, the statistical analysis conducted on geographies consisting of 297,143,432 people shows a moderate positive correlation between the proportion of Argentineans and percentage of population with at least 11th grade education in the United States with a correlation coefficient (R) of 0.417 and weighted average of 92.7%, a difference of 1.1%.
11th Grade Correlation Summary
| Measurement | Immigrants from Czechoslovakia | Argentinean |
| Minimum | 84.9% | 86.3% |
| Maximum | 100.0% | 100.0% |
| Range | 15.1% | 13.7% |
| Mean | 95.4% | 95.4% |
| Median | 95.9% | 95.3% |
| Interquartile 25% (IQ1) | 93.8% | 93.3% |
| Interquartile 75% (IQ3) | 97.4% | 97.9% |
| Interquartile Range (IQR) | 3.7% | 4.6% |
| Standard Deviation (Sample) | 3.3% | 3.2% |
| Standard Deviation (Population) | 3.3% | 3.2% |
Similar Demographics by 11th Grade
Demographics Similar to Immigrants from Czechoslovakia by 11th Grade
In terms of 11th grade, the demographic groups most similar to Immigrants from Czechoslovakia are Romanian (93.8%, a difference of 0.0%), Immigrants from Japan (93.8%, a difference of 0.020%), Immigrants from Latvia (93.8%, a difference of 0.020%), Immigrants from South Africa (93.8%, a difference of 0.050%), and Celtic (93.7%, a difference of 0.050%).
| Demographics | Rating | Rank | 11th Grade |
| Immigrants | Netherlands | 99.8 /100 | #67 | Exceptional 93.9% |
| Zimbabweans | 99.8 /100 | #68 | Exceptional 93.9% |
| Scotch-Irish | 99.8 /100 | #69 | Exceptional 93.9% |
| Immigrants | England | 99.7 /100 | #70 | Exceptional 93.8% |
| Immigrants | South Africa | 99.7 /100 | #71 | Exceptional 93.8% |
| Immigrants | Japan | 99.7 /100 | #72 | Exceptional 93.8% |
| Romanians | 99.6 /100 | #73 | Exceptional 93.8% |
| Immigrants | Czechoslovakia | 99.6 /100 | #74 | Exceptional 93.8% |
| Immigrants | Latvia | 99.6 /100 | #75 | Exceptional 93.8% |
| Celtics | 99.5 /100 | #76 | Exceptional 93.7% |
| Aleuts | 99.5 /100 | #77 | Exceptional 93.7% |
| Soviet Union | 99.5 /100 | #78 | Exceptional 93.7% |
| Immigrants | Denmark | 99.5 /100 | #79 | Exceptional 93.7% |
| Canadians | 99.5 /100 | #80 | Exceptional 93.7% |
| Immigrants | Moldova | 99.5 /100 | #81 | Exceptional 93.7% |
Demographics Similar to Argentineans by 11th Grade
In terms of 11th grade, the demographic groups most similar to Argentineans are Osage (92.7%, a difference of 0.0%), Immigrants from Spain (92.7%, a difference of 0.0%), Potawatomi (92.8%, a difference of 0.010%), Iraqi (92.8%, a difference of 0.010%), and Brazilian (92.8%, a difference of 0.010%).
| Demographics | Rating | Rank | 11th Grade |
| Hmong | 78.6 /100 | #148 | Good 92.8% |
| Immigrants | Poland | 78.5 /100 | #149 | Good 92.8% |
| Immigrants | Egypt | 77.5 /100 | #150 | Good 92.8% |
| Potawatomi | 74.3 /100 | #151 | Good 92.8% |
| Iraqis | 74.2 /100 | #152 | Good 92.8% |
| Brazilians | 73.9 /100 | #153 | Good 92.8% |
| Osage | 73.4 /100 | #154 | Good 92.7% |
| Argentineans | 73.4 /100 | #155 | Good 92.7% |
| Immigrants | Spain | 73.0 /100 | #156 | Good 92.7% |
| Immigrants | Eastern Asia | 72.6 /100 | #157 | Good 92.7% |
| Immigrants | Venezuela | 72.0 /100 | #158 | Good 92.7% |
| Americans | 71.7 /100 | #159 | Good 92.7% |
| Immigrants | Lebanon | 70.7 /100 | #160 | Good 92.7% |
| Immigrants | Argentina | 69.8 /100 | #161 | Good 92.7% |
| Paraguayans | 68.7 /100 | #162 | Good 92.7% |