Immigrants from Cuba vs Immigrants from Yemen No Schooling Completed
COMPARE
Immigrants from Cuba
Immigrants from Yemen
No Schooling Completed
No Schooling Completed Comparison
Immigrants from Cuba
Immigrants from Yemen
2.8%
NO SCHOOLING COMPLETED
0.0/ 100
METRIC RATING
297th/ 347
METRIC RANK
4.1%
NO SCHOOLING COMPLETED
0.0/ 100
METRIC RATING
346th/ 347
METRIC RANK
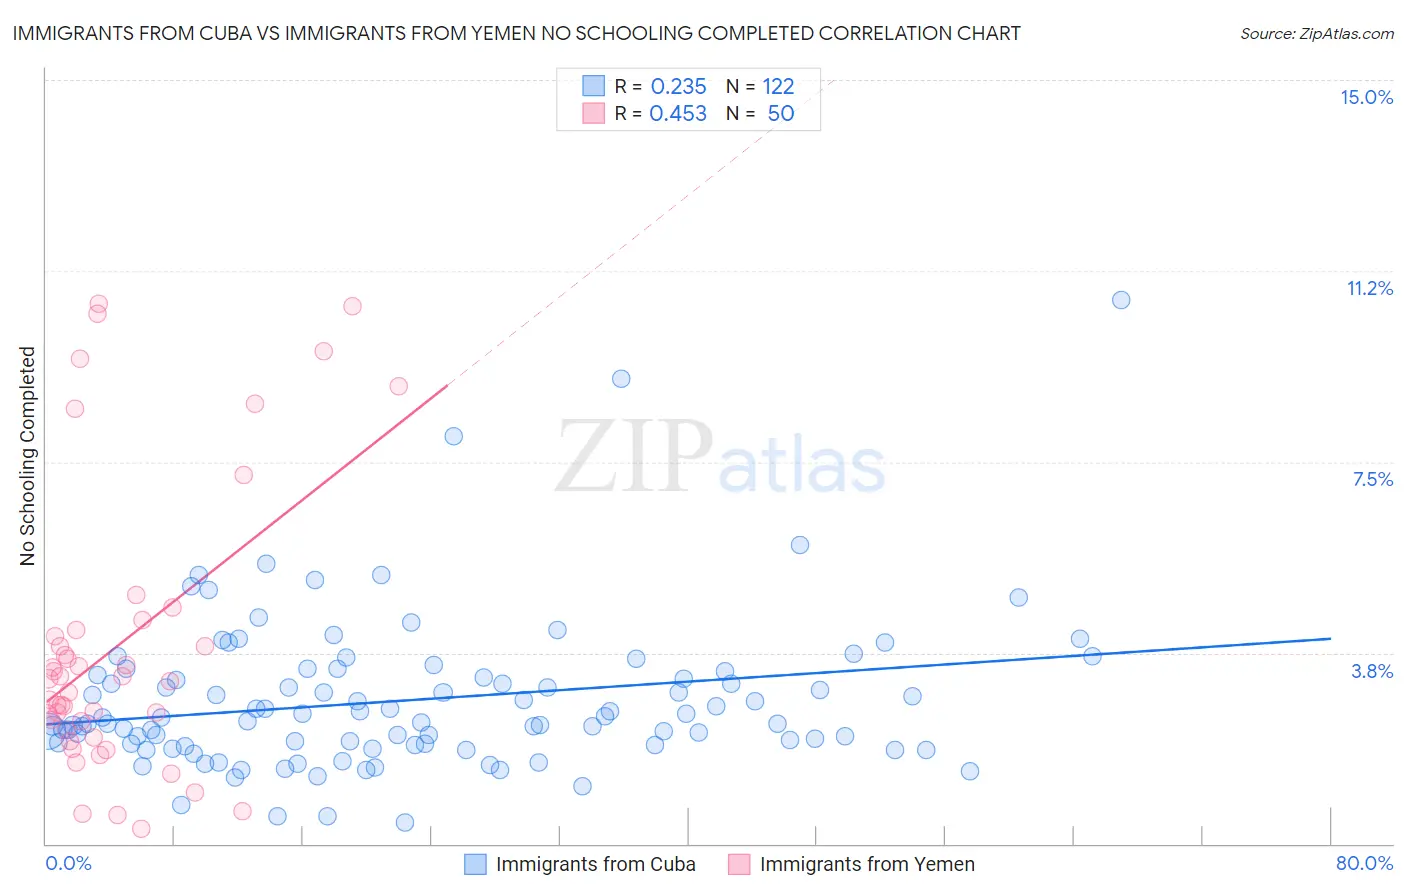
Immigrants from Cuba vs Immigrants from Yemen No Schooling Completed Correlation Chart
The statistical analysis conducted on geographies consisting of 324,009,430 people shows a weak positive correlation between the proportion of Immigrants from Cuba and percentage of population with no schooling in the United States with a correlation coefficient (R) of 0.235 and weighted average of 2.8%. Similarly, the statistical analysis conducted on geographies consisting of 82,409,118 people shows a moderate positive correlation between the proportion of Immigrants from Yemen and percentage of population with no schooling in the United States with a correlation coefficient (R) of 0.453 and weighted average of 4.1%, a difference of 46.3%.
No Schooling Completed Correlation Summary
| Measurement | Immigrants from Cuba | Immigrants from Yemen |
| Minimum | 0.42% | 0.30% |
| Maximum | 10.7% | 10.6% |
| Range | 10.3% | 10.3% |
| Mean | 2.8% | 3.9% |
| Median | 2.5% | 3.2% |
| Interquartile 25% (IQ1) | 2.0% | 2.2% |
| Interquartile 75% (IQ3) | 3.3% | 4.2% |
| Interquartile Range (IQR) | 1.4% | 2.0% |
| Standard Deviation (Sample) | 1.5% | 2.8% |
| Standard Deviation (Population) | 1.5% | 2.8% |
Similar Demographics by No Schooling Completed
Demographics Similar to Immigrants from Cuba by No Schooling Completed
In terms of no schooling completed, the demographic groups most similar to Immigrants from Cuba are Immigrants from Dominica (2.8%, a difference of 0.33%), Central American Indian (2.8%, a difference of 0.84%), Immigrants (2.8%, a difference of 1.1%), Haitian (2.9%, a difference of 1.2%), and Houma (2.8%, a difference of 1.3%).
| Demographics | Rating | Rank | No Schooling Completed |
| Immigrants | Hong Kong | 0.0 /100 | #290 | Tragic 2.7% |
| British West Indians | 0.0 /100 | #291 | Tragic 2.7% |
| Immigrants | Grenada | 0.0 /100 | #292 | Tragic 2.8% |
| Malaysians | 0.0 /100 | #293 | Tragic 2.8% |
| Immigrants | Eritrea | 0.0 /100 | #294 | Tragic 2.8% |
| Houma | 0.0 /100 | #295 | Tragic 2.8% |
| Immigrants | Immigrants | 0.0 /100 | #296 | Tragic 2.8% |
| Immigrants | Cuba | 0.0 /100 | #297 | Tragic 2.8% |
| Immigrants | Dominica | 0.0 /100 | #298 | Tragic 2.8% |
| Central American Indians | 0.0 /100 | #299 | Tragic 2.8% |
| Haitians | 0.0 /100 | #300 | Tragic 2.9% |
| Immigrants | South Eastern Asia | 0.0 /100 | #301 | Tragic 2.9% |
| Immigrants | Caribbean | 0.0 /100 | #302 | Tragic 2.9% |
| Somalis | 0.0 /100 | #303 | Tragic 2.9% |
| Nicaraguans | 0.0 /100 | #304 | Tragic 2.9% |
Demographics Similar to Immigrants from Yemen by No Schooling Completed
In terms of no schooling completed, the demographic groups most similar to Immigrants from Yemen are Spanish American Indian (4.2%, a difference of 1.5%), Immigrants from El Salvador (3.9%, a difference of 6.4%), Nepalese (3.8%, a difference of 8.4%), Salvadoran (3.7%, a difference of 10.2%), and Immigrants from Mexico (3.6%, a difference of 13.2%).
| Demographics | Rating | Rank | No Schooling Completed |
| Immigrants | Dominican Republic | 0.0 /100 | #333 | Tragic 3.4% |
| Guatemalans | 0.0 /100 | #334 | Tragic 3.5% |
| Immigrants | Cambodia | 0.0 /100 | #335 | Tragic 3.5% |
| Immigrants | Fiji | 0.0 /100 | #336 | Tragic 3.5% |
| Immigrants | Cabo Verde | 0.0 /100 | #337 | Tragic 3.5% |
| Bangladeshis | 0.0 /100 | #338 | Tragic 3.5% |
| Yakama | 0.0 /100 | #339 | Tragic 3.6% |
| Immigrants | Guatemala | 0.0 /100 | #340 | Tragic 3.6% |
| Immigrants | Central America | 0.0 /100 | #341 | Tragic 3.6% |
| Immigrants | Mexico | 0.0 /100 | #342 | Tragic 3.6% |
| Salvadorans | 0.0 /100 | #343 | Tragic 3.7% |
| Nepalese | 0.0 /100 | #344 | Tragic 3.8% |
| Immigrants | El Salvador | 0.0 /100 | #345 | Tragic 3.9% |
| Immigrants | Yemen | 0.0 /100 | #346 | Tragic 4.1% |
| Spanish American Indians | 0.0 /100 | #347 | Tragic 4.2% |