Immigrants from Cuba vs Chickasaw 6th Grade
COMPARE
Immigrants from Cuba
Chickasaw
6th Grade
6th Grade Comparison
Immigrants from Cuba
Chickasaw
95.6%
6TH GRADE
0.0/ 100
METRIC RATING
305th/ 347
METRIC RANK
97.6%
6TH GRADE
99.5/ 100
METRIC RATING
71st/ 347
METRIC RANK
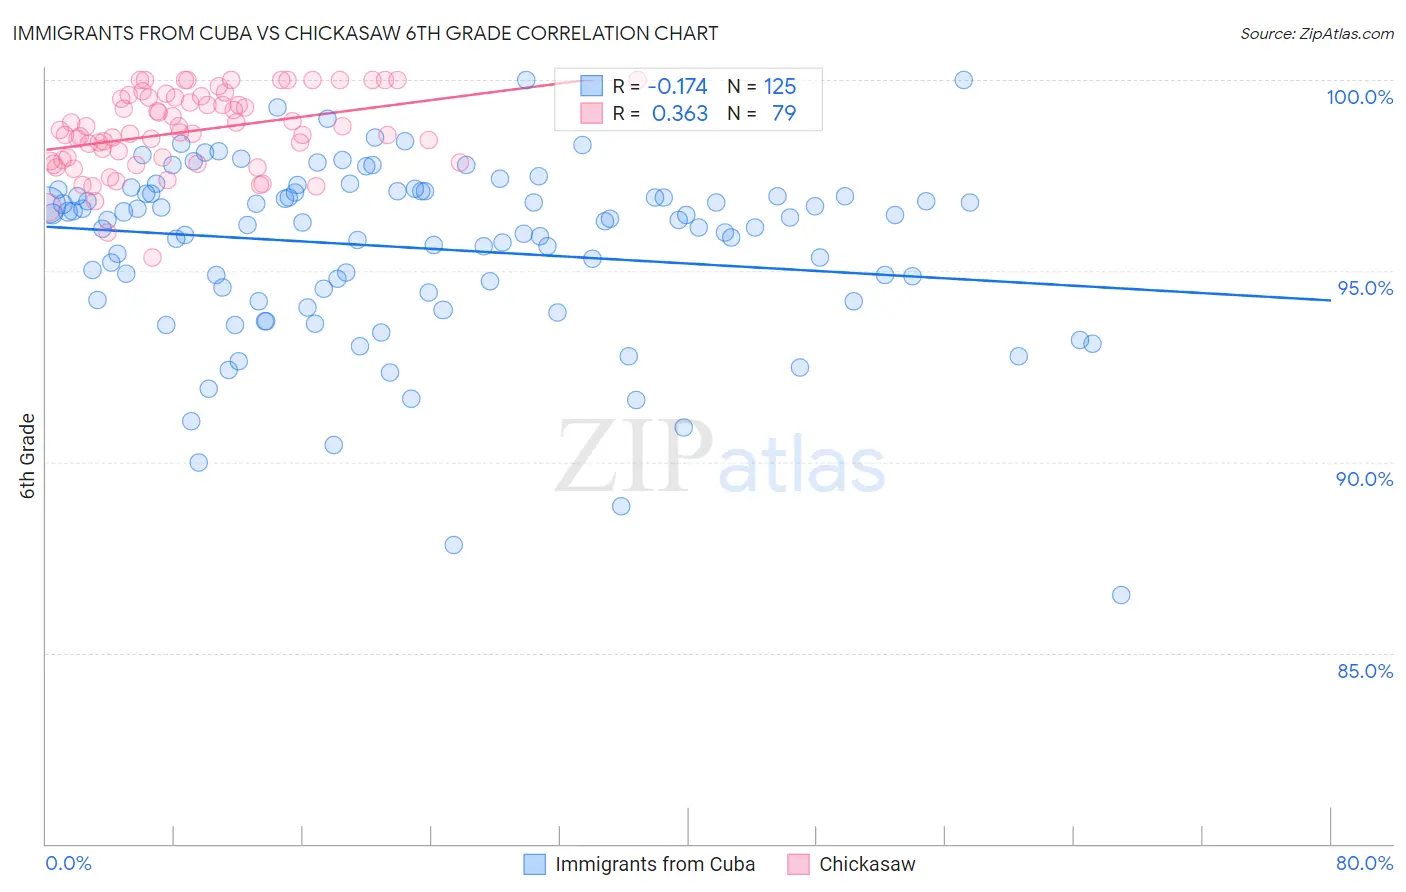
Immigrants from Cuba vs Chickasaw 6th Grade Correlation Chart
The statistical analysis conducted on geographies consisting of 326,028,159 people shows a poor negative correlation between the proportion of Immigrants from Cuba and percentage of population with at least 6th grade education in the United States with a correlation coefficient (R) of -0.174 and weighted average of 95.6%. Similarly, the statistical analysis conducted on geographies consisting of 147,726,545 people shows a mild positive correlation between the proportion of Chickasaw and percentage of population with at least 6th grade education in the United States with a correlation coefficient (R) of 0.363 and weighted average of 97.6%, a difference of 2.1%.
6th Grade Correlation Summary
| Measurement | Immigrants from Cuba | Chickasaw |
| Minimum | 86.5% | 95.4% |
| Maximum | 100.0% | 100.0% |
| Range | 13.5% | 4.6% |
| Mean | 95.6% | 98.7% |
| Median | 96.3% | 98.6% |
| Interquartile 25% (IQ1) | 94.3% | 97.9% |
| Interquartile 75% (IQ3) | 97.0% | 99.6% |
| Interquartile Range (IQR) | 2.7% | 1.7% |
| Standard Deviation (Sample) | 2.3% | 1.0% |
| Standard Deviation (Population) | 2.3% | 1.0% |
Similar Demographics by 6th Grade
Demographics Similar to Immigrants from Cuba by 6th Grade
In terms of 6th grade, the demographic groups most similar to Immigrants from Cuba are Indonesian (95.6%, a difference of 0.020%), Bangladeshi (95.7%, a difference of 0.030%), Immigrants from Haiti (95.6%, a difference of 0.040%), Guyanese (95.6%, a difference of 0.060%), and Immigrants from Caribbean (95.6%, a difference of 0.070%).
| Demographics | Rating | Rank | 6th Grade |
| Sri Lankans | 0.0 /100 | #298 | Tragic 95.8% |
| Immigrants | Laos | 0.0 /100 | #299 | Tragic 95.7% |
| Immigrants | Dominica | 0.0 /100 | #300 | Tragic 95.7% |
| Immigrants | Immigrants | 0.0 /100 | #301 | Tragic 95.7% |
| Immigrants | Burma/Myanmar | 0.0 /100 | #302 | Tragic 95.7% |
| Bangladeshis | 0.0 /100 | #303 | Tragic 95.7% |
| Indonesians | 0.0 /100 | #304 | Tragic 95.6% |
| Immigrants | Cuba | 0.0 /100 | #305 | Tragic 95.6% |
| Immigrants | Haiti | 0.0 /100 | #306 | Tragic 95.6% |
| Guyanese | 0.0 /100 | #307 | Tragic 95.6% |
| Immigrants | Caribbean | 0.0 /100 | #308 | Tragic 95.6% |
| Puerto Ricans | 0.0 /100 | #309 | Tragic 95.5% |
| Ecuadorians | 0.0 /100 | #310 | Tragic 95.5% |
| Immigrants | Portugal | 0.0 /100 | #311 | Tragic 95.5% |
| Immigrants | Guyana | 0.0 /100 | #312 | Tragic 95.5% |
Demographics Similar to Chickasaw by 6th Grade
In terms of 6th grade, the demographic groups most similar to Chickasaw are Cajun (97.6%, a difference of 0.010%), Macedonian (97.6%, a difference of 0.010%), Cherokee (97.6%, a difference of 0.010%), Immigrants from Netherlands (97.6%, a difference of 0.010%), and Iranian (97.6%, a difference of 0.020%).
| Demographics | Rating | Rank | 6th Grade |
| Canadians | 99.7 /100 | #64 | Exceptional 97.7% |
| Immigrants | Northern Europe | 99.6 /100 | #65 | Exceptional 97.7% |
| New Zealanders | 99.6 /100 | #66 | Exceptional 97.7% |
| Kiowa | 99.6 /100 | #67 | Exceptional 97.7% |
| Immigrants | Austria | 99.6 /100 | #68 | Exceptional 97.7% |
| Iranians | 99.6 /100 | #69 | Exceptional 97.6% |
| Cajuns | 99.5 /100 | #70 | Exceptional 97.6% |
| Chickasaw | 99.5 /100 | #71 | Exceptional 97.6% |
| Macedonians | 99.4 /100 | #72 | Exceptional 97.6% |
| Cherokee | 99.4 /100 | #73 | Exceptional 97.6% |
| Immigrants | Netherlands | 99.4 /100 | #74 | Exceptional 97.6% |
| Ukrainians | 99.4 /100 | #75 | Exceptional 97.6% |
| Immigrants | England | 99.4 /100 | #76 | Exceptional 97.6% |
| Immigrants | Lithuania | 99.3 /100 | #77 | Exceptional 97.6% |
| Icelanders | 99.3 /100 | #78 | Exceptional 97.6% |