Immigrants from Croatia vs Immigrants from Sierra Leone High School Diploma
COMPARE
Immigrants from Croatia
Immigrants from Sierra Leone
High School Diploma
High School Diploma Comparison
Immigrants from Croatia
Immigrants from Sierra Leone
90.4%
HIGH SCHOOL DIPLOMA
97.8/ 100
METRIC RATING
104th/ 347
METRIC RANK
88.6%
HIGH SCHOOL DIPLOMA
15.8/ 100
METRIC RATING
207th/ 347
METRIC RANK
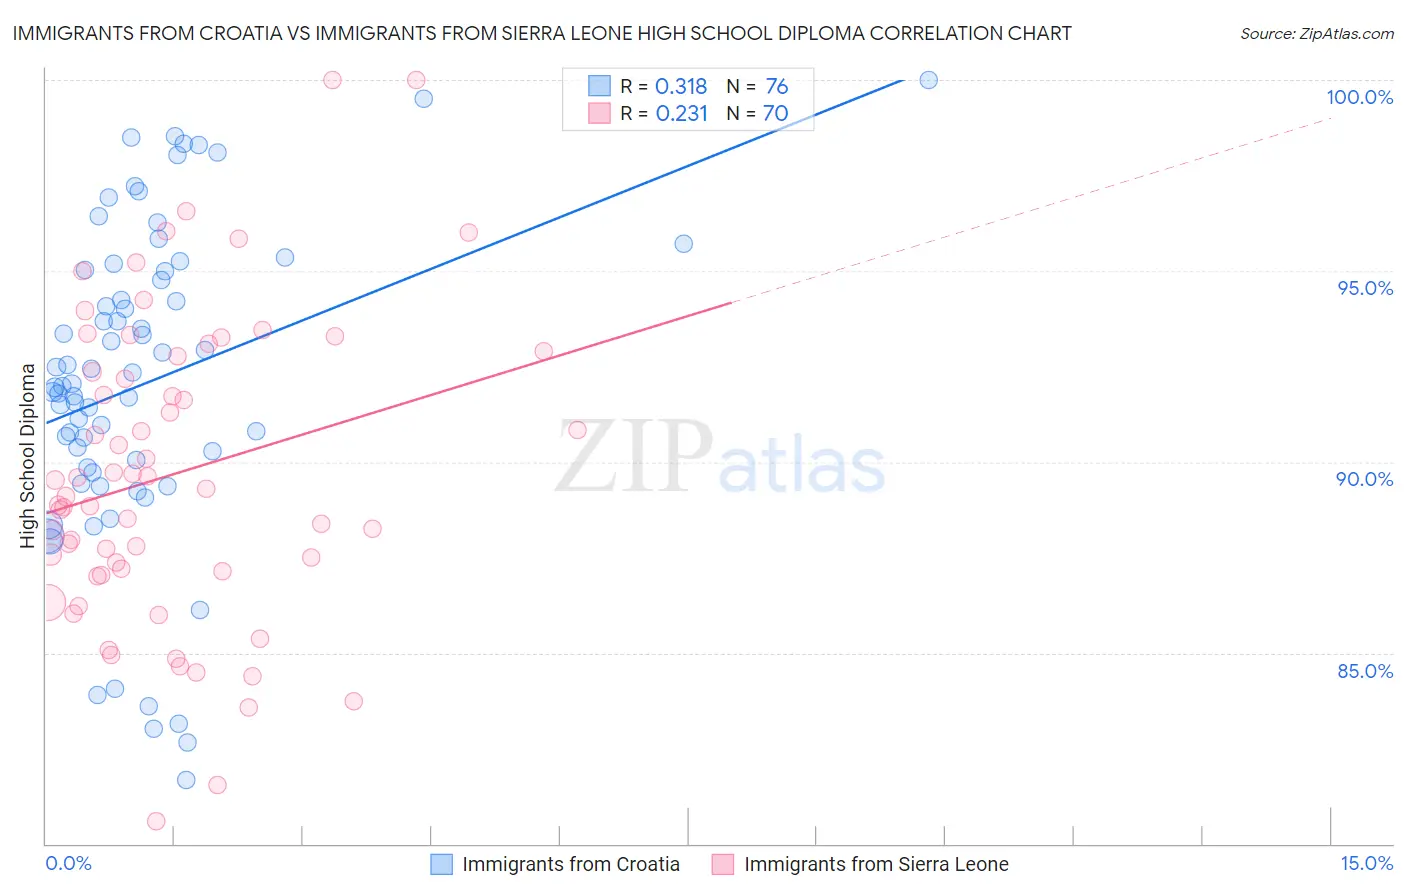
Immigrants from Croatia vs Immigrants from Sierra Leone High School Diploma Correlation Chart
The statistical analysis conducted on geographies consisting of 132,548,119 people shows a mild positive correlation between the proportion of Immigrants from Croatia and percentage of population with at least high school diploma education in the United States with a correlation coefficient (R) of 0.318 and weighted average of 90.4%. Similarly, the statistical analysis conducted on geographies consisting of 101,634,956 people shows a weak positive correlation between the proportion of Immigrants from Sierra Leone and percentage of population with at least high school diploma education in the United States with a correlation coefficient (R) of 0.231 and weighted average of 88.6%, a difference of 2.1%.
High School Diploma Correlation Summary
| Measurement | Immigrants from Croatia | Immigrants from Sierra Leone |
| Minimum | 81.7% | 80.6% |
| Maximum | 100.0% | 100.0% |
| Range | 18.3% | 19.4% |
| Mean | 92.1% | 89.7% |
| Median | 92.0% | 89.2% |
| Interquartile 25% (IQ1) | 89.8% | 87.1% |
| Interquartile 75% (IQ3) | 95.0% | 92.8% |
| Interquartile Range (IQR) | 5.2% | 5.6% |
| Standard Deviation (Sample) | 4.2% | 4.0% |
| Standard Deviation (Population) | 4.2% | 4.0% |
Similar Demographics by High School Diploma
Demographics Similar to Immigrants from Croatia by High School Diploma
In terms of high school diploma, the demographic groups most similar to Immigrants from Croatia are Immigrants from Romania (90.4%, a difference of 0.010%), Aleut (90.4%, a difference of 0.030%), Immigrants from Norway (90.5%, a difference of 0.040%), Immigrants from North Macedonia (90.5%, a difference of 0.060%), and Lebanese (90.4%, a difference of 0.060%).
| Demographics | Rating | Rank | High School Diploma |
| Immigrants | Kuwait | 98.3 /100 | #97 | Exceptional 90.5% |
| Immigrants | Korea | 98.3 /100 | #98 | Exceptional 90.5% |
| Immigrants | Europe | 98.2 /100 | #99 | Exceptional 90.5% |
| Immigrants | North Macedonia | 98.1 /100 | #100 | Exceptional 90.5% |
| Immigrants | Norway | 98.0 /100 | #101 | Exceptional 90.5% |
| Aleuts | 98.0 /100 | #102 | Exceptional 90.4% |
| Immigrants | Romania | 97.8 /100 | #103 | Exceptional 90.4% |
| Immigrants | Croatia | 97.8 /100 | #104 | Exceptional 90.4% |
| Lebanese | 97.4 /100 | #105 | Exceptional 90.4% |
| Syrians | 97.0 /100 | #106 | Exceptional 90.3% |
| Immigrants | Russia | 96.9 /100 | #107 | Exceptional 90.3% |
| Palestinians | 96.7 /100 | #108 | Exceptional 90.3% |
| Immigrants | Zimbabwe | 96.7 /100 | #109 | Exceptional 90.3% |
| Immigrants | Greece | 96.6 /100 | #110 | Exceptional 90.3% |
| Menominee | 96.6 /100 | #111 | Exceptional 90.3% |
Demographics Similar to Immigrants from Sierra Leone by High School Diploma
In terms of high school diploma, the demographic groups most similar to Immigrants from Sierra Leone are Arapaho (88.6%, a difference of 0.010%), Immigrants from Micronesia (88.6%, a difference of 0.020%), Armenian (88.6%, a difference of 0.040%), Portuguese (88.5%, a difference of 0.040%), and Cherokee (88.5%, a difference of 0.040%).
| Demographics | Rating | Rank | High School Diploma |
| Hawaiians | 18.3 /100 | #200 | Poor 88.6% |
| Koreans | 18.1 /100 | #201 | Poor 88.6% |
| Panamanians | 18.0 /100 | #202 | Poor 88.6% |
| Somalis | 17.5 /100 | #203 | Poor 88.6% |
| Armenians | 17.2 /100 | #204 | Poor 88.6% |
| Immigrants | Micronesia | 16.4 /100 | #205 | Poor 88.6% |
| Arapaho | 16.1 /100 | #206 | Poor 88.6% |
| Immigrants | Sierra Leone | 15.8 /100 | #207 | Poor 88.6% |
| Portuguese | 14.4 /100 | #208 | Poor 88.5% |
| Cherokee | 14.3 /100 | #209 | Poor 88.5% |
| Samoans | 14.0 /100 | #210 | Poor 88.5% |
| Inupiat | 13.1 /100 | #211 | Poor 88.5% |
| South American Indians | 12.2 /100 | #212 | Poor 88.5% |
| Immigrants | Somalia | 11.3 /100 | #213 | Poor 88.4% |
| Immigrants | Cameroon | 10.9 /100 | #214 | Poor 88.4% |