Immigrants from Croatia vs Immigrants from Philippines Kindergarten
COMPARE
Immigrants from Croatia
Immigrants from Philippines
Kindergarten
Kindergarten Comparison
Immigrants from Croatia
Immigrants from Philippines
98.1%
KINDERGARTEN
91.2/ 100
METRIC RATING
130th/ 347
METRIC RANK
97.4%
KINDERGARTEN
0.1/ 100
METRIC RATING
276th/ 347
METRIC RANK
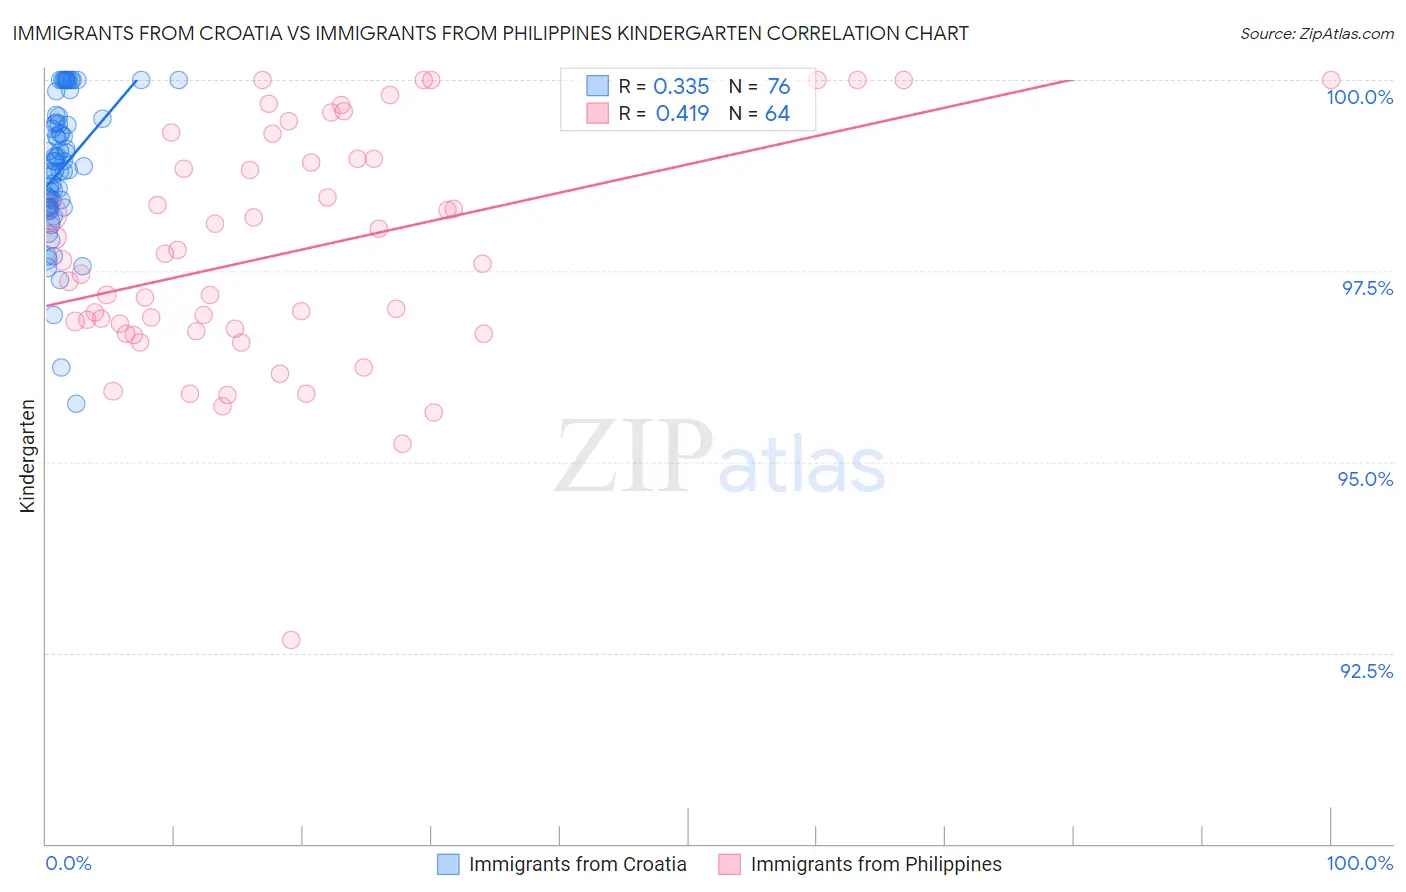
Immigrants from Croatia vs Immigrants from Philippines Kindergarten Correlation Chart
The statistical analysis conducted on geographies consisting of 132,538,077 people shows a mild positive correlation between the proportion of Immigrants from Croatia and percentage of population with at least kindergarten education in the United States with a correlation coefficient (R) of 0.335 and weighted average of 98.1%. Similarly, the statistical analysis conducted on geographies consisting of 471,303,140 people shows a moderate positive correlation between the proportion of Immigrants from Philippines and percentage of population with at least kindergarten education in the United States with a correlation coefficient (R) of 0.419 and weighted average of 97.4%, a difference of 0.72%.
Kindergarten Correlation Summary
| Measurement | Immigrants from Croatia | Immigrants from Philippines |
| Minimum | 95.8% | 92.7% |
| Maximum | 100.0% | 100.0% |
| Range | 4.2% | 7.3% |
| Mean | 98.8% | 97.8% |
| Median | 98.9% | 97.6% |
| Interquartile 25% (IQ1) | 98.3% | 96.7% |
| Interquartile 75% (IQ3) | 99.4% | 99.0% |
| Interquartile Range (IQR) | 1.1% | 2.2% |
| Standard Deviation (Sample) | 0.89% | 1.5% |
| Standard Deviation (Population) | 0.88% | 1.5% |
Similar Demographics by Kindergarten
Demographics Similar to Immigrants from Croatia by Kindergarten
In terms of kindergarten, the demographic groups most similar to Immigrants from Croatia are Seminole (98.1%, a difference of 0.0%), Cambodian (98.1%, a difference of 0.0%), Spaniard (98.1%, a difference of 0.0%), Immigrants from Serbia (98.1%, a difference of 0.010%), and Immigrants from Europe (98.1%, a difference of 0.010%).
| Demographics | Rating | Rank | Kindergarten |
| Menominee | 93.9 /100 | #123 | Exceptional 98.2% |
| Syrians | 93.6 /100 | #124 | Exceptional 98.2% |
| Iroquois | 93.5 /100 | #125 | Exceptional 98.2% |
| Lebanese | 93.5 /100 | #126 | Exceptional 98.2% |
| Immigrants | Saudi Arabia | 93.1 /100 | #127 | Exceptional 98.1% |
| Immigrants | Serbia | 92.4 /100 | #128 | Exceptional 98.1% |
| Seminole | 91.5 /100 | #129 | Exceptional 98.1% |
| Immigrants | Croatia | 91.2 /100 | #130 | Exceptional 98.1% |
| Cambodians | 91.2 /100 | #131 | Exceptional 98.1% |
| Spaniards | 91.0 /100 | #132 | Exceptional 98.1% |
| Immigrants | Europe | 90.4 /100 | #133 | Exceptional 98.1% |
| Immigrants | Bulgaria | 89.4 /100 | #134 | Excellent 98.1% |
| Immigrants | Kuwait | 89.2 /100 | #135 | Excellent 98.1% |
| Immigrants | Hungary | 89.1 /100 | #136 | Excellent 98.1% |
| Blackfeet | 87.8 /100 | #137 | Excellent 98.1% |
Demographics Similar to Immigrants from Philippines by Kindergarten
In terms of kindergarten, the demographic groups most similar to Immigrants from Philippines are Immigrants from Western Africa (97.4%, a difference of 0.010%), Immigrants from China (97.4%, a difference of 0.020%), Immigrants from Cameroon (97.4%, a difference of 0.020%), Ghanaian (97.4%, a difference of 0.020%), and Immigrants from Uzbekistan (97.4%, a difference of 0.030%).
| Demographics | Rating | Rank | Kindergarten |
| West Indians | 0.3 /100 | #269 | Tragic 97.5% |
| Immigrants | Jamaica | 0.2 /100 | #270 | Tragic 97.5% |
| Immigrants | Peru | 0.2 /100 | #271 | Tragic 97.5% |
| Immigrants | Bolivia | 0.2 /100 | #272 | Tragic 97.5% |
| Immigrants | China | 0.1 /100 | #273 | Tragic 97.4% |
| Immigrants | Cameroon | 0.1 /100 | #274 | Tragic 97.4% |
| Ghanaians | 0.1 /100 | #275 | Tragic 97.4% |
| Immigrants | Philippines | 0.1 /100 | #276 | Tragic 97.4% |
| Immigrants | Western Africa | 0.1 /100 | #277 | Tragic 97.4% |
| Immigrants | Uzbekistan | 0.1 /100 | #278 | Tragic 97.4% |
| Immigrants | Ghana | 0.1 /100 | #279 | Tragic 97.4% |
| Barbadians | 0.1 /100 | #280 | Tragic 97.4% |
| Trinidadians and Tobagonians | 0.1 /100 | #281 | Tragic 97.4% |
| Afghans | 0.0 /100 | #282 | Tragic 97.4% |
| Immigrants | West Indies | 0.0 /100 | #283 | Tragic 97.3% |