Immigrants from Costa Rica vs Welsh 8th Grade

COMPARE

Immigrants from Costa Rica
Race
Ancestry
AfghanAfricanAlaska NativeAlaskan AthabascanAlbanianAleutAlsatianAmericanApacheArabArapahoArgentineanArmenianAssyrian/Chaldean/SyriacAustralianAustrianBahamianBangladeshiBarbadianBasqueBelgianBelizeanBermudanBhutaneseBlackfeetBolivianBrazilianBritishBritish West IndianBulgarianBurmeseCajunCambodianCanadianCape VerdeanCarpatho RusynCelticCentral AmericanCentral American IndianCherokeeCheyenneChickasawChileanChineseChippewaChoctawColombianColvilleComancheCosta RicanCreeCreekCroatianCrowCubanCypriotCzechCzechoslovakianDanishDelawareDominicanDutchDutch West IndianEastern EuropeanEcuadorianEgyptianEnglishEstonianEthiopianEuropeanFijianFilipinoFinnishFrenchFrench American IndianFrench CanadianGermanGerman RussianGhanaianGreekGuamanian/ChamorroGuatemalanGuyaneseHaitianHmongHonduranHopiHoumaHungarianIcelanderIndian (Asian)IndonesianInupiatIranianIraqiIrishIroquoisIsraeliItalianJamaicanJapaneseJordanianKenyanKiowaKoreanLaotianLatvianLebaneseLiberianLithuanianLumbeeLuxembourgerMacedonianMalaysianMalteseMarshalleseMenomineeMexicanMexican American IndianMongolianMoroccanNative HawaiianNavajoNepaleseNew ZealanderNicaraguanNigerianNorthern EuropeanNorwegianOkinawanOsageOttawaPaiutePakistaniPalestinianPanamanianParaguayanPennsylvania GermanPeruvianPimaPolishPortuguesePotawatomiPuebloPuerto RicanPuget Sound SalishRomanianRussianSalvadoranSamoanScandinavianScotch-IrishScottishSeminoleSenegaleseSerbianShoshoneSierra LeoneanSiouxSlavicSlovakSloveneSomaliSouth AfricanSouth AmericanSouth American IndianSoviet UnionSpaniardSpanishSpanish AmericanSpanish American IndianSri LankanSubsaharan AfricanSudaneseSwedishSwissSyrianTaiwaneseThaiTlingit-HaidaTohono O'OdhamTonganTrinidadian and TobagonianTsimshianTurkishU.S. Virgin IslanderUgandanUkrainianUruguayanUteVenezuelanVietnameseWest IndianYakamaYaquiYugoslavianYumanYup'ikZimbabwean
Immigration
NonimmigrantsImmigrantsAfghanistanAfricaAlbaniaArgentinaArmeniaAsiaAustraliaAustriaBahamasBangladeshBarbadosBelarusBelgiumBelizeBoliviaBosnia and HerzegovinaBrazilBulgariaBurma/MyanmarCabo VerdeCambodiaCameroonCanadaCaribbeanCentral AmericaChileChinaColombiaCongoCosta RicaCroatiaCubaCzechoslovakiaDenmarkDominicaDominican RepublicEastern AfricaEastern AsiaEastern EuropeEcuadorEgyptEl SalvadorEnglandEritreaEthiopiaEuropeFijiFranceGermanyGhanaGreeceGrenadaGuatemalaGuyanaHaitiHondurasHong KongHungaryIndiaIndonesiaIranIraqIrelandIsraelItalyJamaicaJapanJordanKazakhstanKenyaKoreaKuwaitLaosLatin AmericaLatviaLebanonLiberiaLithuaniaMalaysiaMexicoMicronesiaMiddle AfricaMoldovaMoroccoNepalNetherlandsNicaraguaNigeriaNorth AmericaNorth MacedoniaNorthern AfricaNorthern EuropeNorwayOceaniaPakistanPanamaPeruPhilippinesPolandPortugalRomaniaRussiaSaudi ArabiaScotlandSenegalSerbiaSierra LeoneSingaporeSomaliaSouth AfricaSouth AmericaSouth Central AsiaSouth Eastern AsiaSouthern EuropeSpainSri LankaSt. Vincent and the GrenadinesSudanSwedenSwitzerlandSyriaTaiwanThailandTrinidad and TobagoTurkeyUgandaUkraineUruguayUzbekistanVenezuelaVietnamWest IndiesWestern AfricaWestern AsiaWestern EuropeYemenZaireZimbabweAzores
Welsh
Race
Ancestry
AfghanAfricanAlaska NativeAlaskan AthabascanAlbanianAleutAlsatianAmericanApacheArabArapahoArgentineanArmenianAssyrian/Chaldean/SyriacAustralianAustrianBahamianBangladeshiBarbadianBasqueBelgianBelizeanBermudanBhutaneseBlackfeetBolivianBrazilianBritishBritish West IndianBulgarianBurmeseCajunCambodianCanadianCape VerdeanCarpatho RusynCelticCentral AmericanCentral American IndianCherokeeCheyenneChickasawChileanChineseChippewaChoctawColombianColvilleComancheCosta RicanCreeCreekCroatianCrowCubanCypriotCzechCzechoslovakianDanishDelawareDominicanDutchDutch West IndianEastern EuropeanEcuadorianEgyptianEnglishEstonianEthiopianEuropeanFijianFilipinoFinnishFrenchFrench American IndianFrench CanadianGermanGerman RussianGhanaianGreekGuamanian/ChamorroGuatemalanGuyaneseHaitianHmongHonduranHopiHoumaHungarianIcelanderIndian (Asian)IndonesianInupiatIranianIraqiIrishIroquoisIsraeliItalianJamaicanJapaneseJordanianKenyanKiowaKoreanLaotianLatvianLebaneseLiberianLithuanianLumbeeLuxembourgerMacedonianMalaysianMalteseMarshalleseMenomineeMexicanMexican American IndianMongolianMoroccanNative HawaiianNavajoNepaleseNew ZealanderNicaraguanNigerianNorthern EuropeanNorwegianOkinawanOsageOttawaPaiutePakistaniPalestinianPanamanianParaguayanPennsylvania GermanPeruvianPimaPolishPortuguesePotawatomiPuebloPuerto RicanPuget Sound SalishRomanianRussianSalvadoranSamoanScandinavianScotch-IrishScottishSeminoleSenegaleseSerbianShoshoneSierra LeoneanSiouxSlavicSlovakSloveneSomaliSouth AfricanSouth AmericanSouth American IndianSoviet UnionSpaniardSpanishSpanish AmericanSpanish American IndianSri LankanSubsaharan AfricanSudaneseSwedishSwissSyrianTaiwaneseThaiTlingit-HaidaTohono O'OdhamTonganTrinidadian and TobagonianTsimshianTurkishU.S. Virgin IslanderUgandanUkrainianUruguayanUteVenezuelanVietnameseWelshWest IndianYakamaYaquiYugoslavianYumanYup'ikZimbabwean
Immigration
NonimmigrantsImmigrantsAfghanistanAfricaAlbaniaArgentinaArmeniaAsiaAustraliaAustriaBahamasBangladeshBarbadosBelarusBelgiumBelizeBoliviaBosnia and HerzegovinaBrazilBulgariaBurma/MyanmarCabo VerdeCambodiaCameroonCanadaCaribbeanCentral AmericaChileChinaColombiaCongoCroatiaCubaCzechoslovakiaDenmarkDominicaDominican RepublicEastern AfricaEastern AsiaEastern EuropeEcuadorEgyptEl SalvadorEnglandEritreaEthiopiaEuropeFijiFranceGermanyGhanaGreeceGrenadaGuatemalaGuyanaHaitiHondurasHong KongHungaryIndiaIndonesiaIranIraqIrelandIsraelItalyJamaicaJapanJordanKazakhstanKenyaKoreaKuwaitLaosLatin AmericaLatviaLebanonLiberiaLithuaniaMalaysiaMexicoMicronesiaMiddle AfricaMoldovaMoroccoNepalNetherlandsNicaraguaNigeriaNorth AmericaNorth MacedoniaNorthern AfricaNorthern EuropeNorwayOceaniaPakistanPanamaPeruPhilippinesPolandPortugalRomaniaRussiaSaudi ArabiaScotlandSenegalSerbiaSierra LeoneSingaporeSomaliaSouth AfricaSouth AmericaSouth Central AsiaSouth Eastern AsiaSouthern EuropeSpainSri LankaSt. Vincent and the GrenadinesSudanSwedenSwitzerlandSyriaTaiwanThailandTrinidad and TobagoTurkeyUgandaUkraineUruguayUzbekistanVenezuelaVietnamWest IndiesWestern AfricaWestern AsiaWestern EuropeYemenZaireZimbabweAzores
8th Grade
Income
Poverty
Unemployment
Labor Participation
Family Structure
Vehicle Availability
Education Level
Disability

8th Grade Comparison

Immigrants from Costa Rica

Welsh

Tragic
Exceptional
94.9%
8TH GRADE
0.5/ 100
METRIC RATING
261st/ 347
METRIC RANK
97.2%
8TH GRADE
100.0/ 100
METRIC RATING
22nd/ 347
METRIC RANK

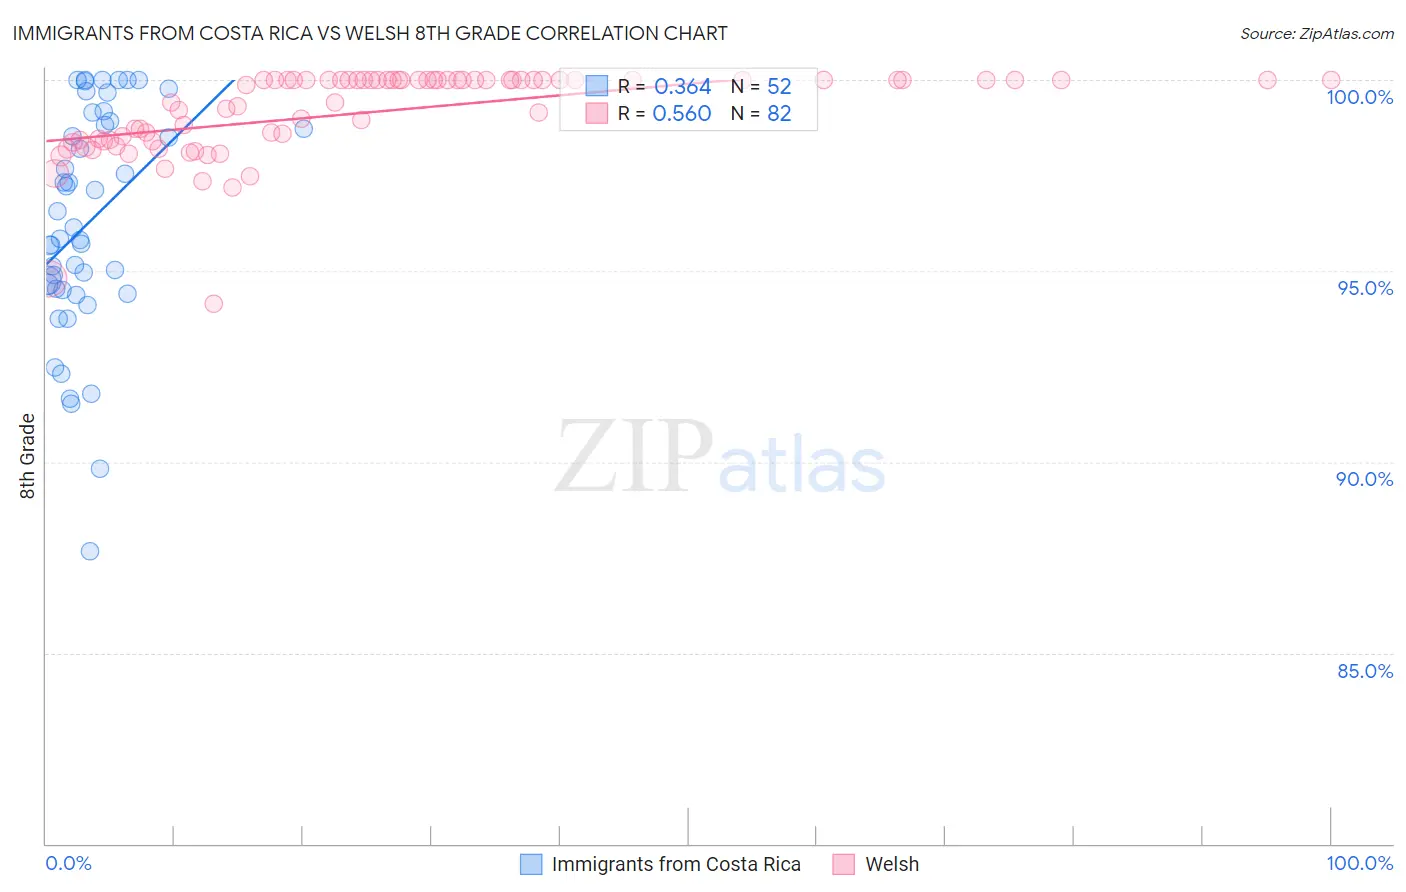
Immigrants from Costa Rica vs Welsh 8th Grade Correlation Chart

The statistical analysis conducted on geographies consisting of 204,277,408 people shows a mild positive correlation between the proportion of Immigrants from Costa Rica and percentage of population with at least 8th grade education in the United States with a correlation coefficient (R) of 0.364 and weighted average of 94.9%. Similarly, the statistical analysis conducted on geographies consisting of 528,593,877 people shows a substantial positive correlation between the proportion of Welsh and percentage of population with at least 8th grade education in the United States with a correlation coefficient (R) of 0.560 and weighted average of 97.2%, a difference of 2.4%.
Immigrants from Costa Rica vs Welsh 8th Grade

8th Grade Correlation Summary

MeasurementImmigrants from Costa RicaWelsh
Minimum87.6%94.1%
Maximum100.0%100.0%
Range12.4%5.9%
Mean96.3%99.2%
Median96.0%100.0%
Interquartile 25% (IQ1)94.5%98.4%
Interquartile 75% (IQ3)98.9%100.0%
Interquartile Range (IQR)4.4%1.6%
Standard Deviation (Sample)3.0%1.1%
Standard Deviation (Population)2.9%1.1%

Similar Demographics by 8th Grade

Demographics Similar to Immigrants from Costa Rica by 8th Grade

In terms of 8th grade, the demographic groups most similar to Immigrants from Costa Rica are Immigrants from Nigeria (94.9%, a difference of 0.020%), Immigrants from Hong Kong (94.9%, a difference of 0.020%), South American (94.9%, a difference of 0.030%), Yuman (94.9%, a difference of 0.030%), and Immigrants from Congo (94.9%, a difference of 0.040%).
DemographicsRating | Rank8th Grade
Immigrants | Cameroon
0.8
/100
|
#254
Tragic
95.0%
Immigrants | Somalia
0.7
/100
|
#255
Tragic
95.0%
Colombians
0.7
/100
|
#256
Tragic
95.0%
Afghans
0.6
/100
|
#257
Tragic
94.9%
Immigrants | Congo
0.6
/100
|
#258
Tragic
94.9%
Ghanaians
0.6
/100
|
#259
Tragic
94.9%
Immigrants | Jamaica
0.6
/100
|
#260
Tragic
94.9%
Immigrants | Costa Rica
0.5
/100
|
#261
Tragic
94.9%
Immigrants | Nigeria
0.4
/100
|
#262
Tragic
94.9%
Immigrants | Hong Kong
0.4
/100
|
#263
Tragic
94.9%
South Americans
0.4
/100
|
#264
Tragic
94.9%
Yuman
0.4
/100
|
#265
Tragic
94.9%
West Indians
0.3
/100
|
#266
Tragic
94.8%
Immigrants | Ghana
0.3
/100
|
#267
Tragic
94.8%
Immigrants | Uruguay
0.3
/100
|
#268
Tragic
94.8%

Demographics Similar to Welsh by 8th Grade

In terms of 8th grade, the demographic groups most similar to Welsh are French Canadian (97.2%, a difference of 0.010%), Scandinavian (97.2%, a difference of 0.010%), Czech (97.1%, a difference of 0.020%), Danish (97.2%, a difference of 0.030%), and French (97.1%, a difference of 0.030%).
DemographicsRating | Rank8th Grade
Pennsylvania Germans
100.0
/100
|
#15
Exceptional
97.3%
Tlingit-Haida
100.0
/100
|
#16
Exceptional
97.3%
Irish
100.0
/100
|
#17
Exceptional
97.3%
Lithuanians
100.0
/100
|
#18
Exceptional
97.3%
Scottish
100.0
/100
|
#19
Exceptional
97.3%
Croatians
100.0
/100
|
#20
Exceptional
97.2%
Danes
100.0
/100
|
#21
Exceptional
97.2%
Welsh
100.0
/100
|
#22
Exceptional
97.2%
French Canadians
100.0
/100
|
#23
Exceptional
97.2%
Scandinavians
100.0
/100
|
#24
Exceptional
97.2%
Czechs
100.0
/100
|
#25
Exceptional
97.1%
French
100.0
/100
|
#26
Exceptional
97.1%
Scotch-Irish
100.0
/100
|
#27
Exceptional
97.1%
Italians
100.0
/100
|
#28
Exceptional
97.1%
Europeans
100.0
/100
|
#29
Exceptional
97.1%