Immigrants from Costa Rica vs Moroccan Nursery School
COMPARE
Immigrants from Costa Rica
Moroccan
Nursery School
Nursery School Comparison
Immigrants from Costa Rica
Moroccans
97.7%
NURSERY SCHOOL
3.5/ 100
METRIC RATING
225th/ 347
METRIC RANK
97.8%
NURSERY SCHOOL
8.3/ 100
METRIC RATING
213th/ 347
METRIC RANK
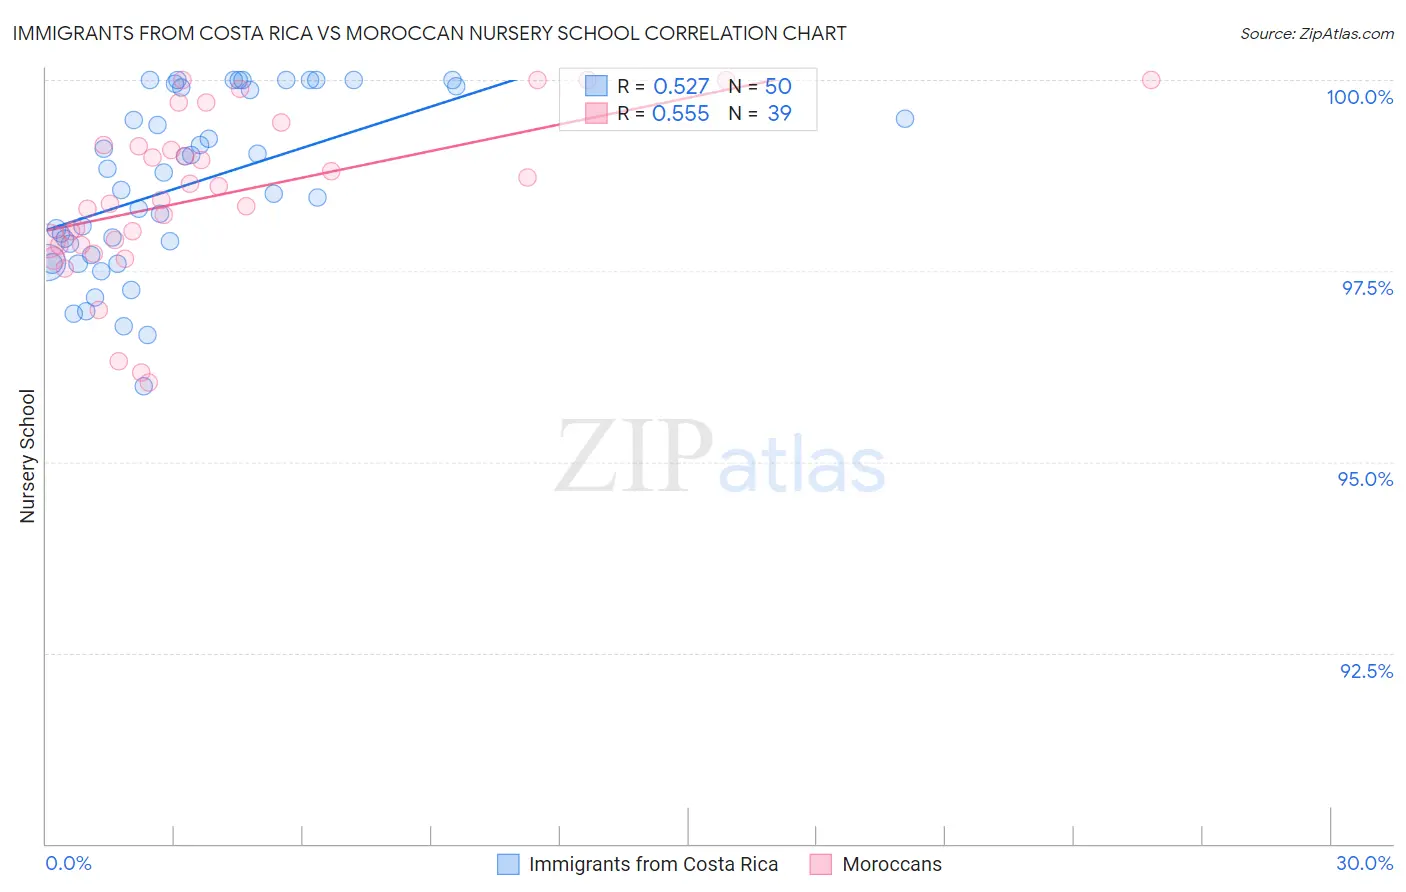
Immigrants from Costa Rica vs Moroccan Nursery School Correlation Chart
The statistical analysis conducted on geographies consisting of 204,274,109 people shows a substantial positive correlation between the proportion of Immigrants from Costa Rica and percentage of population with at least nursery school education in the United States with a correlation coefficient (R) of 0.527 and weighted average of 97.7%. Similarly, the statistical analysis conducted on geographies consisting of 201,817,667 people shows a substantial positive correlation between the proportion of Moroccans and percentage of population with at least nursery school education in the United States with a correlation coefficient (R) of 0.555 and weighted average of 97.8%, a difference of 0.070%.
Nursery School Correlation Summary
| Measurement | Immigrants from Costa Rica | Moroccan |
| Minimum | 96.0% | 96.0% |
| Maximum | 100.0% | 100.0% |
| Range | 4.0% | 4.0% |
| Mean | 98.6% | 98.5% |
| Median | 98.7% | 98.4% |
| Interquartile 25% (IQ1) | 97.7% | 97.8% |
| Interquartile 75% (IQ3) | 99.9% | 99.1% |
| Interquartile Range (IQR) | 2.2% | 1.3% |
| Standard Deviation (Sample) | 1.1% | 1.1% |
| Standard Deviation (Population) | 1.1% | 1.0% |
Demographics Similar to Immigrants from Costa Rica and Moroccans by Nursery School
In terms of nursery school, the demographic groups most similar to Immigrants from Costa Rica are Immigrants from Nepal (97.7%, a difference of 0.0%), Iraqi (97.7%, a difference of 0.0%), Immigrants from Syria (97.7%, a difference of 0.010%), Immigrants from Sudan (97.7%, a difference of 0.010%), and Subsaharan African (97.7%, a difference of 0.010%). Similarly, the demographic groups most similar to Moroccans are Immigrants from Bahamas (97.8%, a difference of 0.0%), South American Indian (97.8%, a difference of 0.0%), Laotian (97.8%, a difference of 0.010%), Bahamian (97.8%, a difference of 0.010%), and Uruguayan (97.8%, a difference of 0.010%).
| Demographics | Rating | Rank | Nursery School |
| Costa Ricans | 11.3 /100 | #209 | Poor 97.8% |
| Immigrants | Oceania | 10.2 /100 | #210 | Poor 97.8% |
| Laotians | 9.8 /100 | #211 | Tragic 97.8% |
| Immigrants | Bahamas | 8.6 /100 | #212 | Tragic 97.8% |
| Moroccans | 8.3 /100 | #213 | Tragic 97.8% |
| South American Indians | 8.0 /100 | #214 | Tragic 97.8% |
| Bahamians | 7.4 /100 | #215 | Tragic 97.8% |
| Uruguayans | 7.1 /100 | #216 | Tragic 97.8% |
| Samoans | 6.3 /100 | #217 | Tragic 97.8% |
| Immigrants | Panama | 5.3 /100 | #218 | Tragic 97.8% |
| Immigrants | Morocco | 5.1 /100 | #219 | Tragic 97.8% |
| Immigrants | Zaire | 4.4 /100 | #220 | Tragic 97.8% |
| Tongans | 4.3 /100 | #221 | Tragic 97.8% |
| Immigrants | Syria | 4.0 /100 | #222 | Tragic 97.7% |
| Immigrants | Sudan | 3.9 /100 | #223 | Tragic 97.7% |
| Immigrants | Nepal | 3.6 /100 | #224 | Tragic 97.7% |
| Immigrants | Costa Rica | 3.5 /100 | #225 | Tragic 97.7% |
| Iraqis | 3.5 /100 | #226 | Tragic 97.7% |
| Sub-Saharan Africans | 3.2 /100 | #227 | Tragic 97.7% |
| Sudanese | 3.2 /100 | #228 | Tragic 97.7% |
| Senegalese | 3.2 /100 | #229 | Tragic 97.7% |