Immigrants from Colombia vs Immigrants from Singapore 10th Grade
COMPARE
Immigrants from Colombia
Immigrants from Singapore
10th Grade
10th Grade Comparison
Immigrants from Colombia
Immigrants from Singapore
92.5%
10TH GRADE
0.3/ 100
METRIC RATING
269th/ 347
METRIC RANK
95.0%
10TH GRADE
99.8/ 100
METRIC RATING
63rd/ 347
METRIC RANK
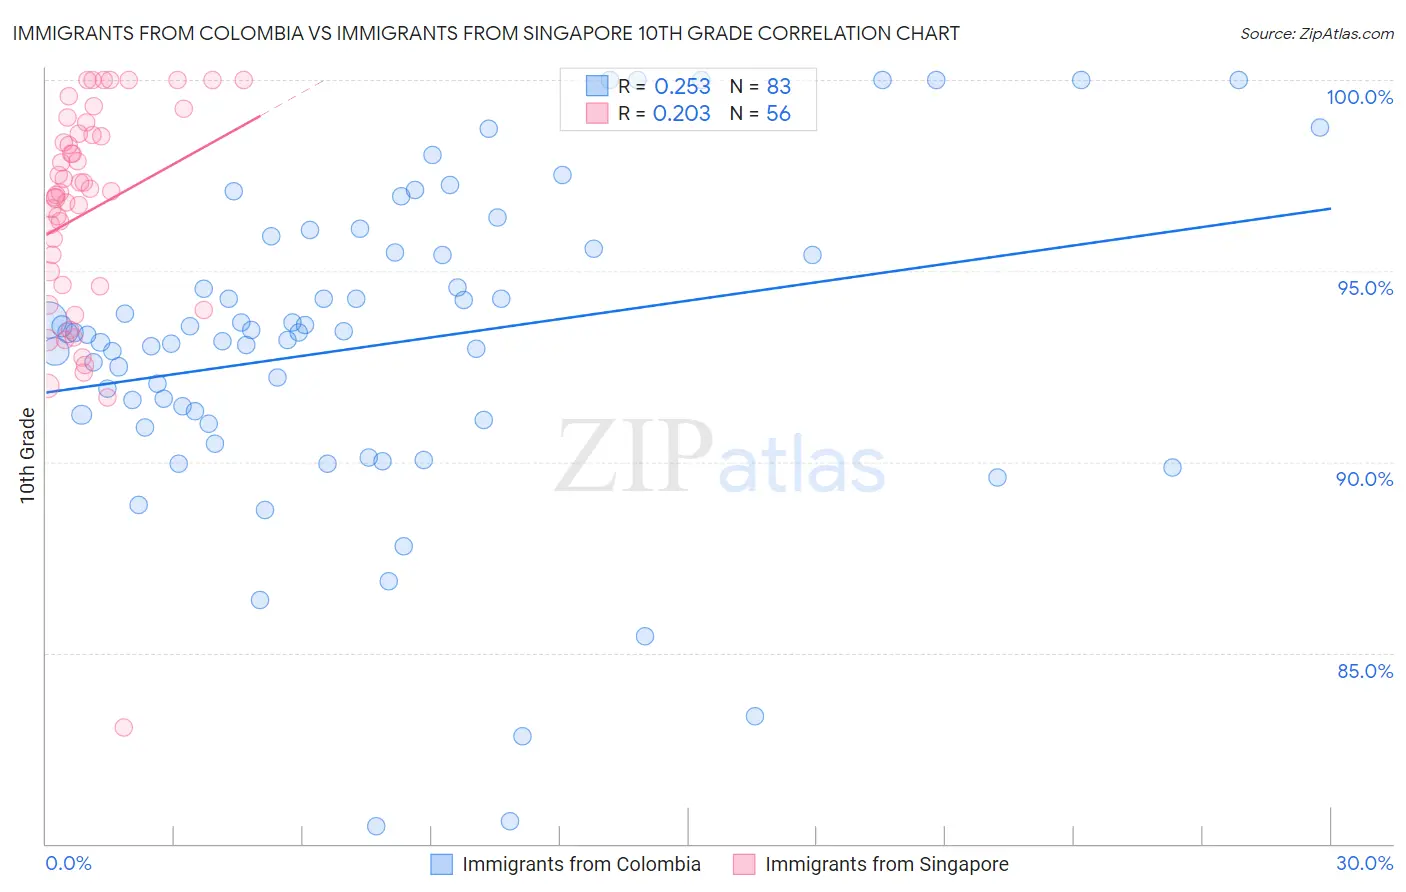
Immigrants from Colombia vs Immigrants from Singapore 10th Grade Correlation Chart
The statistical analysis conducted on geographies consisting of 378,643,826 people shows a weak positive correlation between the proportion of Immigrants from Colombia and percentage of population with at least 10th grade education in the United States with a correlation coefficient (R) of 0.253 and weighted average of 92.5%. Similarly, the statistical analysis conducted on geographies consisting of 137,521,094 people shows a weak positive correlation between the proportion of Immigrants from Singapore and percentage of population with at least 10th grade education in the United States with a correlation coefficient (R) of 0.203 and weighted average of 95.0%, a difference of 2.7%.
10th Grade Correlation Summary
| Measurement | Immigrants from Colombia | Immigrants from Singapore |
| Minimum | 80.4% | 83.0% |
| Maximum | 100.0% | 100.0% |
| Range | 19.6% | 17.0% |
| Mean | 93.1% | 96.5% |
| Median | 93.4% | 97.1% |
| Interquartile 25% (IQ1) | 91.1% | 94.6% |
| Interquartile 75% (IQ3) | 95.5% | 98.6% |
| Interquartile Range (IQR) | 4.4% | 4.0% |
| Standard Deviation (Sample) | 4.1% | 3.0% |
| Standard Deviation (Population) | 4.1% | 3.0% |
Similar Demographics by 10th Grade
Demographics Similar to Immigrants from Colombia by 10th Grade
In terms of 10th grade, the demographic groups most similar to Immigrants from Colombia are Immigrants from Uruguay (92.5%, a difference of 0.0%), Taiwanese (92.5%, a difference of 0.020%), Immigrants from Ghana (92.5%, a difference of 0.020%), Immigrants from Eritrea (92.5%, a difference of 0.020%), and Immigrants from Western Africa (92.5%, a difference of 0.020%).
| Demographics | Rating | Rank | 10th Grade |
| Immigrants | South America | 0.4 /100 | #262 | Tragic 92.6% |
| Apache | 0.4 /100 | #263 | Tragic 92.6% |
| Peruvians | 0.4 /100 | #264 | Tragic 92.6% |
| Dutch West Indians | 0.4 /100 | #265 | Tragic 92.6% |
| Immigrants | Philippines | 0.4 /100 | #266 | Tragic 92.6% |
| Taiwanese | 0.3 /100 | #267 | Tragic 92.5% |
| Immigrants | Ghana | 0.3 /100 | #268 | Tragic 92.5% |
| Immigrants | Colombia | 0.3 /100 | #269 | Tragic 92.5% |
| Immigrants | Uruguay | 0.3 /100 | #270 | Tragic 92.5% |
| Immigrants | Eritrea | 0.3 /100 | #271 | Tragic 92.5% |
| Immigrants | Western Africa | 0.3 /100 | #272 | Tragic 92.5% |
| Trinidadians and Tobagonians | 0.2 /100 | #273 | Tragic 92.4% |
| Immigrants | Congo | 0.2 /100 | #274 | Tragic 92.4% |
| West Indians | 0.2 /100 | #275 | Tragic 92.4% |
| Immigrants | Trinidad and Tobago | 0.1 /100 | #276 | Tragic 92.3% |
Demographics Similar to Immigrants from Singapore by 10th Grade
In terms of 10th grade, the demographic groups most similar to Immigrants from Singapore are Thai (95.0%, a difference of 0.0%), Cypriot (95.0%, a difference of 0.010%), Chippewa (95.0%, a difference of 0.010%), Native Hawaiian (95.0%, a difference of 0.010%), and Ukrainian (95.0%, a difference of 0.020%).
| Demographics | Rating | Rank | 10th Grade |
| New Zealanders | 99.8 /100 | #56 | Exceptional 95.0% |
| Ukrainians | 99.8 /100 | #57 | Exceptional 95.0% |
| Aleuts | 99.8 /100 | #58 | Exceptional 95.0% |
| Celtics | 99.8 /100 | #59 | Exceptional 95.0% |
| Cypriots | 99.8 /100 | #60 | Exceptional 95.0% |
| Chippewa | 99.8 /100 | #61 | Exceptional 95.0% |
| Thais | 99.8 /100 | #62 | Exceptional 95.0% |
| Immigrants | Singapore | 99.8 /100 | #63 | Exceptional 95.0% |
| Native Hawaiians | 99.7 /100 | #64 | Exceptional 95.0% |
| Turks | 99.7 /100 | #65 | Exceptional 95.0% |
| Immigrants | Australia | 99.7 /100 | #66 | Exceptional 94.9% |
| Immigrants | Netherlands | 99.7 /100 | #67 | Exceptional 94.9% |
| Immigrants | Belgium | 99.7 /100 | #68 | Exceptional 94.9% |
| Immigrants | England | 99.6 /100 | #69 | Exceptional 94.9% |
| Zimbabweans | 99.6 /100 | #70 | Exceptional 94.9% |