Immigrants from Colombia vs Immigrants from France 8th Grade
COMPARE
Immigrants from Colombia
Immigrants from France
8th Grade
8th Grade Comparison
Immigrants from Colombia
Immigrants from France
94.7%
8TH GRADE
0.2/ 100
METRIC RATING
275th/ 347
METRIC RANK
96.2%
8TH GRADE
95.3/ 100
METRIC RATING
120th/ 347
METRIC RANK
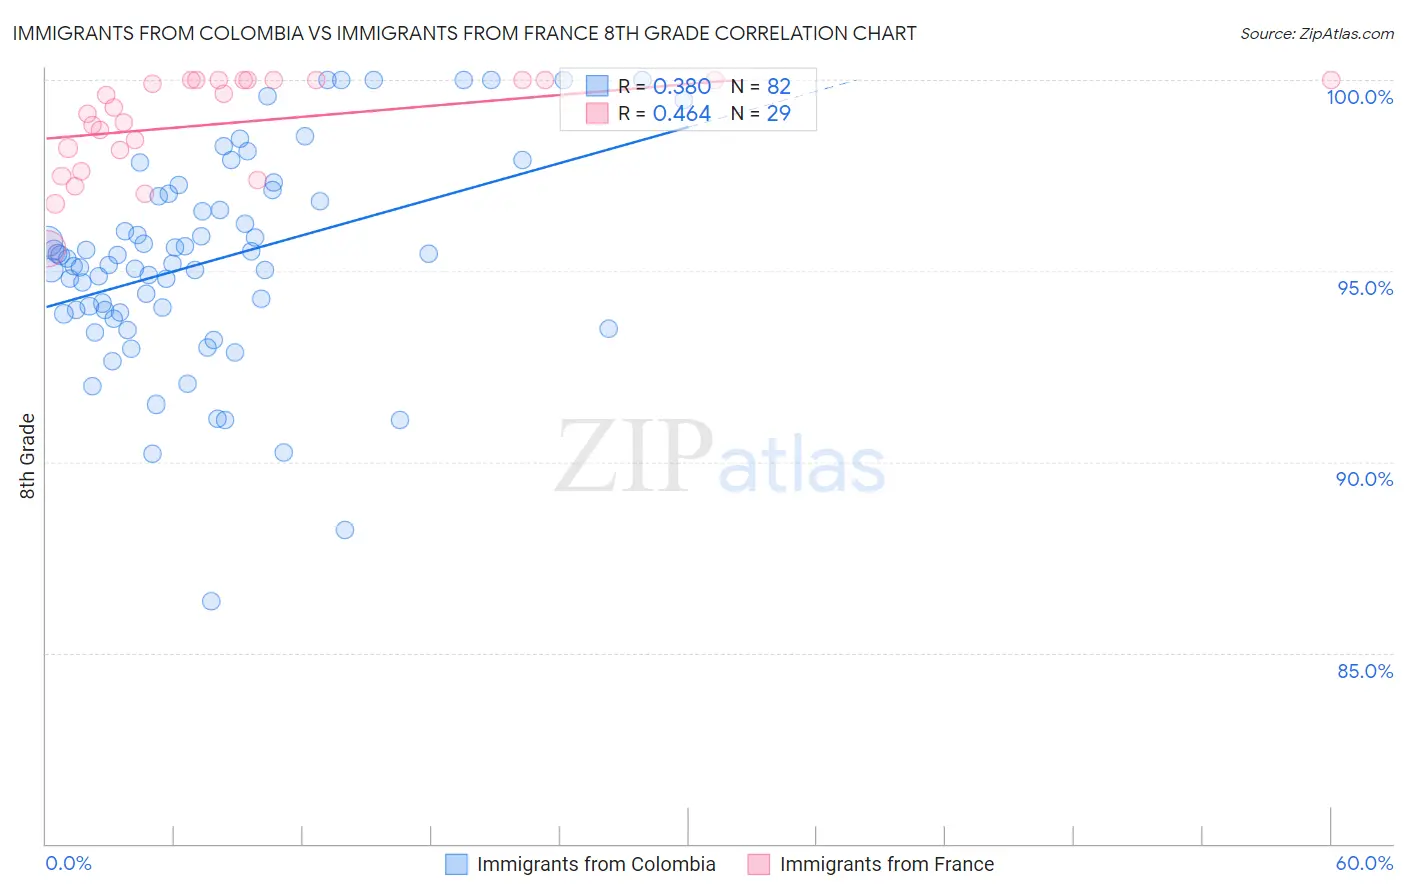
Immigrants from Colombia vs Immigrants from France 8th Grade Correlation Chart
The statistical analysis conducted on geographies consisting of 378,598,469 people shows a mild positive correlation between the proportion of Immigrants from Colombia and percentage of population with at least 8th grade education in the United States with a correlation coefficient (R) of 0.380 and weighted average of 94.7%. Similarly, the statistical analysis conducted on geographies consisting of 287,919,934 people shows a moderate positive correlation between the proportion of Immigrants from France and percentage of population with at least 8th grade education in the United States with a correlation coefficient (R) of 0.464 and weighted average of 96.2%, a difference of 1.5%.
8th Grade Correlation Summary
| Measurement | Immigrants from Colombia | Immigrants from France |
| Minimum | 86.4% | 95.6% |
| Maximum | 100.0% | 100.0% |
| Range | 13.6% | 4.4% |
| Mean | 95.3% | 98.9% |
| Median | 95.3% | 99.3% |
| Interquartile 25% (IQ1) | 93.9% | 97.9% |
| Interquartile 75% (IQ3) | 96.9% | 100.0% |
| Interquartile Range (IQR) | 3.0% | 2.1% |
| Standard Deviation (Sample) | 2.7% | 1.3% |
| Standard Deviation (Population) | 2.7% | 1.2% |
Similar Demographics by 8th Grade
Demographics Similar to Immigrants from Colombia by 8th Grade
In terms of 8th grade, the demographic groups most similar to Immigrants from Colombia are Trinidadian and Tobagonian (94.7%, a difference of 0.010%), Immigrants from Western Africa (94.8%, a difference of 0.020%), Immigrants from South America (94.8%, a difference of 0.030%), Peruvian (94.7%, a difference of 0.030%), and Immigrants from Uzbekistan (94.8%, a difference of 0.040%).
| Demographics | Rating | Rank | 8th Grade |
| Immigrants | Uruguay | 0.3 /100 | #268 | Tragic 94.8% |
| Immigrants | Thailand | 0.2 /100 | #269 | Tragic 94.8% |
| Immigrants | Uzbekistan | 0.2 /100 | #270 | Tragic 94.8% |
| Immigrants | Afghanistan | 0.2 /100 | #271 | Tragic 94.8% |
| Immigrants | South America | 0.2 /100 | #272 | Tragic 94.8% |
| Immigrants | Western Africa | 0.2 /100 | #273 | Tragic 94.8% |
| Trinidadians and Tobagonians | 0.2 /100 | #274 | Tragic 94.7% |
| Immigrants | Colombia | 0.2 /100 | #275 | Tragic 94.7% |
| Peruvians | 0.1 /100 | #276 | Tragic 94.7% |
| Taiwanese | 0.1 /100 | #277 | Tragic 94.7% |
| Armenians | 0.1 /100 | #278 | Tragic 94.7% |
| Immigrants | Trinidad and Tobago | 0.1 /100 | #279 | Tragic 94.6% |
| Barbadians | 0.1 /100 | #280 | Tragic 94.6% |
| Immigrants | Bolivia | 0.1 /100 | #281 | Tragic 94.6% |
| Immigrants | Eritrea | 0.1 /100 | #282 | Tragic 94.6% |
Demographics Similar to Immigrants from France by 8th Grade
In terms of 8th grade, the demographic groups most similar to Immigrants from France are Immigrants from Switzerland (96.2%, a difference of 0.0%), Immigrants from Bulgaria (96.2%, a difference of 0.0%), Immigrants from Europe (96.2%, a difference of 0.0%), Immigrants from Norway (96.2%, a difference of 0.020%), and Filipino (96.2%, a difference of 0.020%).
| Demographics | Rating | Rank | 8th Grade |
| Immigrants | Zimbabwe | 96.7 /100 | #113 | Exceptional 96.3% |
| Immigrants | Japan | 96.5 /100 | #114 | Exceptional 96.2% |
| Immigrants | Moldova | 96.5 /100 | #115 | Exceptional 96.2% |
| Immigrants | Nonimmigrants | 96.0 /100 | #116 | Exceptional 96.2% |
| Immigrants | Croatia | 96.0 /100 | #117 | Exceptional 96.2% |
| Immigrants | Norway | 95.7 /100 | #118 | Exceptional 96.2% |
| Immigrants | Switzerland | 95.3 /100 | #119 | Exceptional 96.2% |
| Immigrants | France | 95.3 /100 | #120 | Exceptional 96.2% |
| Immigrants | Bulgaria | 95.3 /100 | #121 | Exceptional 96.2% |
| Immigrants | Europe | 95.3 /100 | #122 | Exceptional 96.2% |
| Filipinos | 94.6 /100 | #123 | Exceptional 96.2% |
| Palestinians | 94.6 /100 | #124 | Exceptional 96.2% |
| Immigrants | Romania | 94.1 /100 | #125 | Exceptional 96.2% |
| Choctaw | 94.0 /100 | #126 | Exceptional 96.2% |
| Immigrants | Serbia | 94.0 /100 | #127 | Exceptional 96.2% |