Immigrants from Colombia vs French American Indian Doctorate Degree
COMPARE
Immigrants from Colombia
French American Indian
Doctorate Degree
Doctorate Degree Comparison
Immigrants from Colombia
French American Indians
1.7%
DOCTORATE DEGREE
6.7/ 100
METRIC RATING
225th/ 347
METRIC RANK
1.6%
DOCTORATE DEGREE
2.0/ 100
METRIC RATING
244th/ 347
METRIC RANK
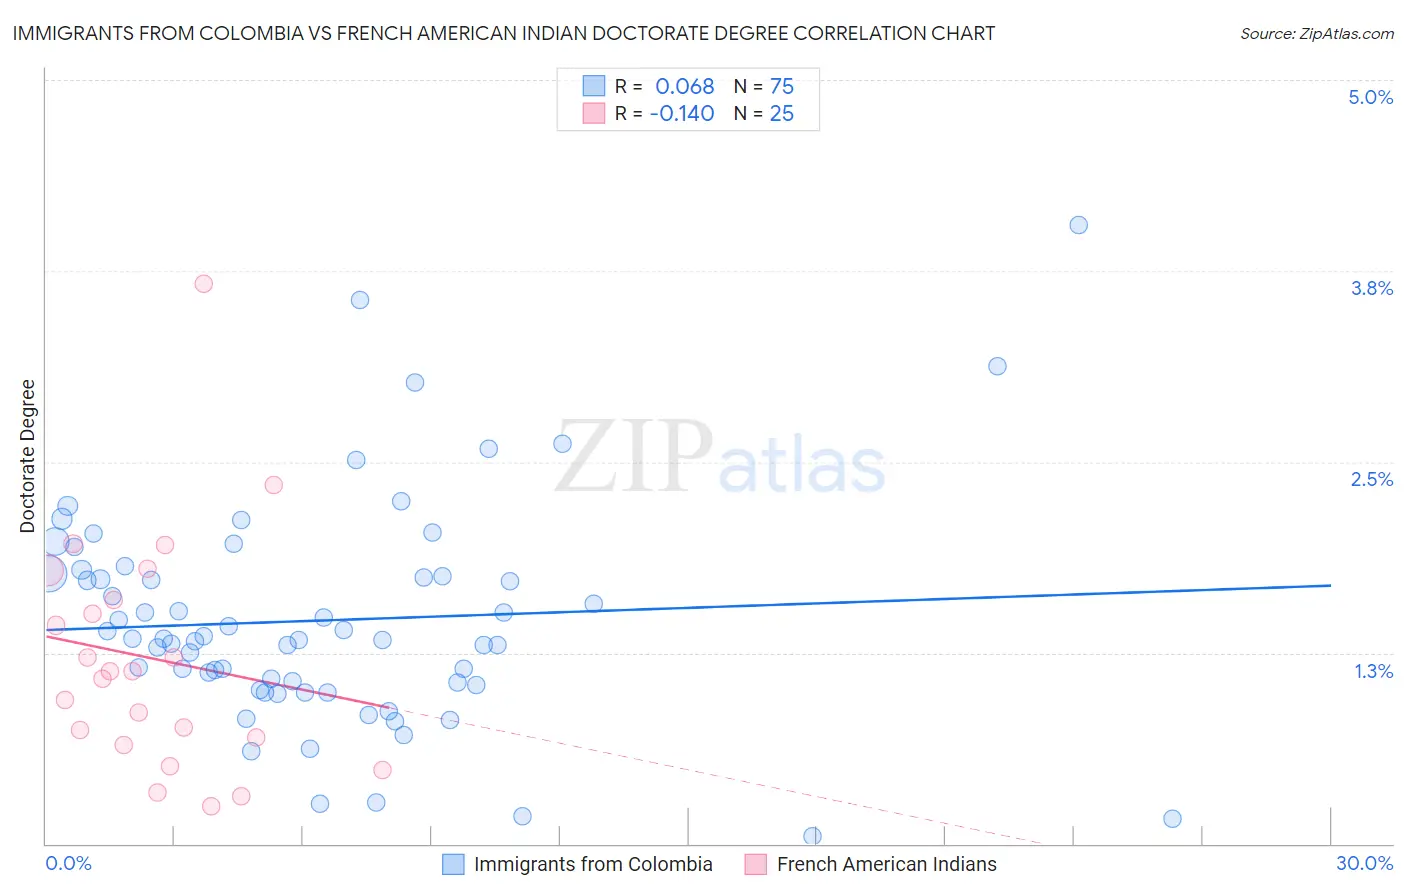
Immigrants from Colombia vs French American Indian Doctorate Degree Correlation Chart
The statistical analysis conducted on geographies consisting of 375,852,559 people shows a slight positive correlation between the proportion of Immigrants from Colombia and percentage of population with at least doctorate degree education in the United States with a correlation coefficient (R) of 0.068 and weighted average of 1.7%. Similarly, the statistical analysis conducted on geographies consisting of 131,174,413 people shows a poor negative correlation between the proportion of French American Indians and percentage of population with at least doctorate degree education in the United States with a correlation coefficient (R) of -0.140 and weighted average of 1.6%, a difference of 5.3%.
Doctorate Degree Correlation Summary
| Measurement | Immigrants from Colombia | French American Indian |
| Minimum | 0.049% | 0.24% |
| Maximum | 4.1% | 3.7% |
| Range | 4.0% | 3.4% |
| Mean | 1.5% | 1.2% |
| Median | 1.3% | 1.1% |
| Interquartile 25% (IQ1) | 1.0% | 0.67% |
| Interquartile 75% (IQ3) | 1.8% | 1.7% |
| Interquartile Range (IQR) | 0.73% | 1.0% |
| Standard Deviation (Sample) | 0.73% | 0.77% |
| Standard Deviation (Population) | 0.72% | 0.75% |
Demographics Similar to Immigrants from Colombia and French American Indians by Doctorate Degree
In terms of doctorate degree, the demographic groups most similar to Immigrants from Colombia are Osage (1.7%, a difference of 0.12%), Panamanian (1.7%, a difference of 0.26%), Immigrants from Poland (1.7%, a difference of 0.49%), Assyrian/Chaldean/Syriac (1.7%, a difference of 0.53%), and Colville (1.6%, a difference of 1.6%). Similarly, the demographic groups most similar to French American Indians are Native Hawaiian (1.6%, a difference of 0.19%), Ottawa (1.6%, a difference of 0.32%), Cheyenne (1.6%, a difference of 0.53%), Immigrants from Panama (1.6%, a difference of 0.72%), and West Indian (1.6%, a difference of 0.91%).
| Demographics | Rating | Rank | Doctorate Degree |
| Immigrants | Poland | 7.4 /100 | #224 | Tragic 1.7% |
| Immigrants | Colombia | 6.7 /100 | #225 | Tragic 1.7% |
| Osage | 6.5 /100 | #226 | Tragic 1.7% |
| Panamanians | 6.3 /100 | #227 | Tragic 1.7% |
| Assyrians/Chaldeans/Syriacs | 5.9 /100 | #228 | Tragic 1.7% |
| Colville | 4.7 /100 | #229 | Tragic 1.6% |
| Immigrants | Philippines | 4.3 /100 | #230 | Tragic 1.6% |
| Immigrants | North Macedonia | 3.9 /100 | #231 | Tragic 1.6% |
| Guamanians/Chamorros | 3.3 /100 | #232 | Tragic 1.6% |
| Barbadians | 3.3 /100 | #233 | Tragic 1.6% |
| Hopi | 3.2 /100 | #234 | Tragic 1.6% |
| Cree | 3.0 /100 | #235 | Tragic 1.6% |
| Indonesians | 2.8 /100 | #236 | Tragic 1.6% |
| Iroquois | 2.7 /100 | #237 | Tragic 1.6% |
| Immigrants | Congo | 2.6 /100 | #238 | Tragic 1.6% |
| West Indians | 2.5 /100 | #239 | Tragic 1.6% |
| Immigrants | Panama | 2.4 /100 | #240 | Tragic 1.6% |
| Cheyenne | 2.3 /100 | #241 | Tragic 1.6% |
| Ottawa | 2.2 /100 | #242 | Tragic 1.6% |
| Native Hawaiians | 2.1 /100 | #243 | Tragic 1.6% |
| French American Indians | 2.0 /100 | #244 | Tragic 1.6% |