Immigrants from Colombia vs Cape Verdean Associate's Degree
COMPARE
Immigrants from Colombia
Cape Verdean
Associate's Degree
Associate's Degree Comparison
Immigrants from Colombia
Cape Verdeans
46.0%
ASSOCIATE'S DEGREE
41.3/ 100
METRIC RATING
181st/ 347
METRIC RANK
38.8%
ASSOCIATE'S DEGREE
0.0/ 100
METRIC RATING
297th/ 347
METRIC RANK
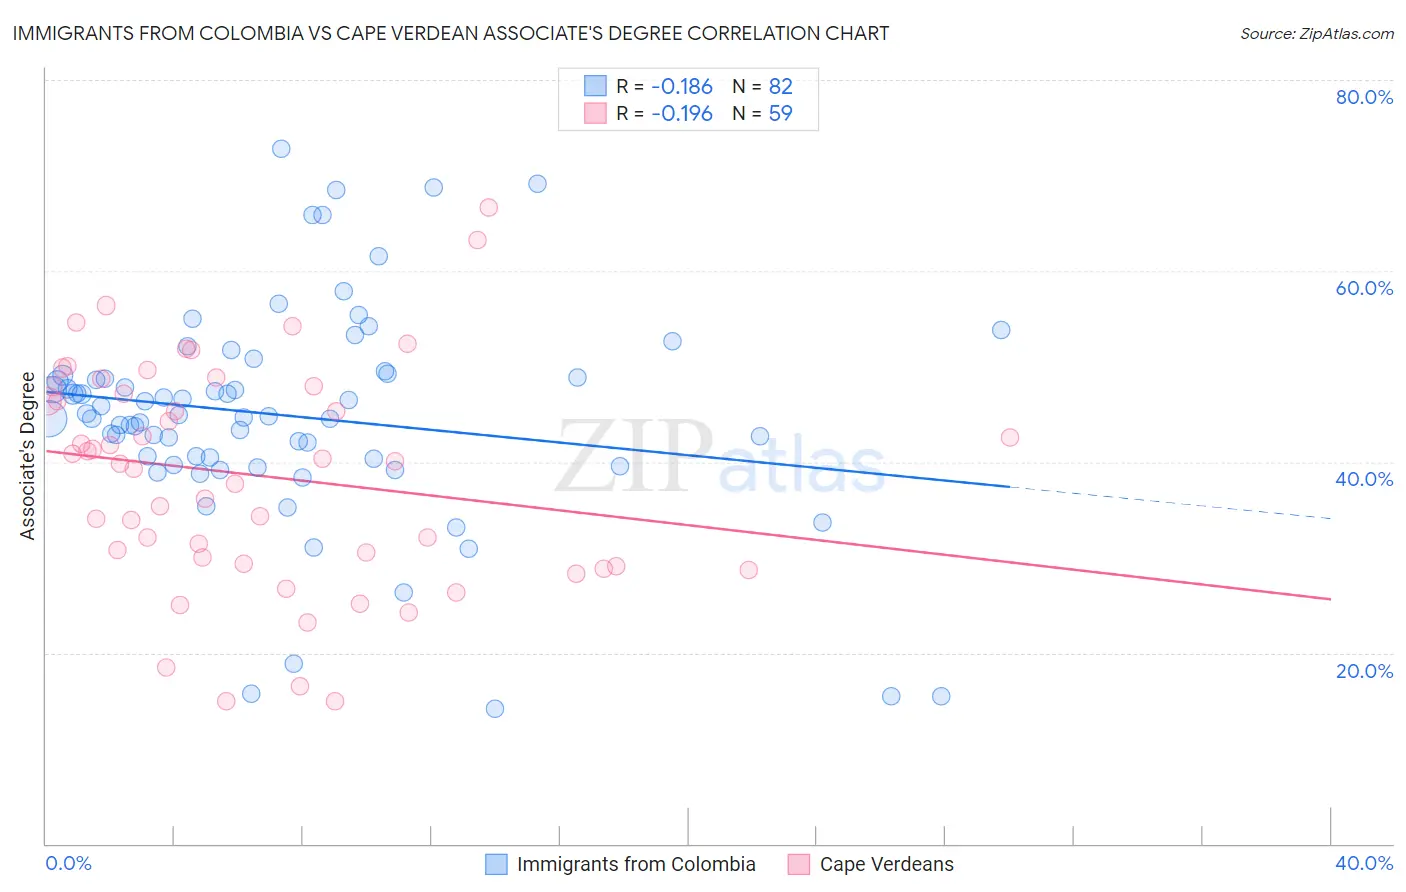
Immigrants from Colombia vs Cape Verdean Associate's Degree Correlation Chart
The statistical analysis conducted on geographies consisting of 378,676,952 people shows a poor negative correlation between the proportion of Immigrants from Colombia and percentage of population with at least associate's degree education in the United States with a correlation coefficient (R) of -0.186 and weighted average of 46.0%. Similarly, the statistical analysis conducted on geographies consisting of 107,580,652 people shows a poor negative correlation between the proportion of Cape Verdeans and percentage of population with at least associate's degree education in the United States with a correlation coefficient (R) of -0.196 and weighted average of 38.8%, a difference of 18.8%.
Associate's Degree Correlation Summary
| Measurement | Immigrants from Colombia | Cape Verdean |
| Minimum | 14.1% | 14.9% |
| Maximum | 72.8% | 66.6% |
| Range | 58.7% | 51.7% |
| Mean | 44.8% | 38.6% |
| Median | 44.8% | 40.1% |
| Interquartile 25% (IQ1) | 40.3% | 29.3% |
| Interquartile 75% (IQ3) | 49.1% | 47.9% |
| Interquartile Range (IQR) | 8.8% | 18.6% |
| Standard Deviation (Sample) | 11.4% | 11.7% |
| Standard Deviation (Population) | 11.3% | 11.6% |
Similar Demographics by Associate's Degree
Demographics Similar to Immigrants from Colombia by Associate's Degree
In terms of associate's degree, the demographic groups most similar to Immigrants from Colombia are Swiss (46.0%, a difference of 0.070%), Yugoslavian (46.0%, a difference of 0.080%), Czechoslovakian (46.0%, a difference of 0.10%), Costa Rican (46.0%, a difference of 0.21%), and Welsh (45.9%, a difference of 0.27%).
| Demographics | Rating | Rank | Associate's Degree |
| English | 50.0 /100 | #174 | Average 46.4% |
| Belgians | 48.9 /100 | #175 | Average 46.3% |
| Finns | 48.5 /100 | #176 | Average 46.3% |
| Slovaks | 48.4 /100 | #177 | Average 46.3% |
| Immigrants | Bosnia and Herzegovina | 48.3 /100 | #178 | Average 46.3% |
| Sri Lankans | 47.6 /100 | #179 | Average 46.3% |
| Bermudans | 46.4 /100 | #180 | Average 46.2% |
| Immigrants | Colombia | 41.3 /100 | #181 | Average 46.0% |
| Swiss | 40.4 /100 | #182 | Average 46.0% |
| Yugoslavians | 40.2 /100 | #183 | Average 46.0% |
| Czechoslovakians | 40.0 /100 | #184 | Average 46.0% |
| Costa Ricans | 38.6 /100 | #185 | Fair 46.0% |
| Welsh | 37.9 /100 | #186 | Fair 45.9% |
| Immigrants | Uruguay | 35.5 /100 | #187 | Fair 45.8% |
| Ghanaians | 35.5 /100 | #188 | Fair 45.8% |
Demographics Similar to Cape Verdeans by Associate's Degree
In terms of associate's degree, the demographic groups most similar to Cape Verdeans are Cheyenne (38.7%, a difference of 0.26%), Cherokee (38.9%, a difference of 0.28%), Ute (38.6%, a difference of 0.36%), Chickasaw (38.6%, a difference of 0.40%), and Honduran (38.9%, a difference of 0.45%).
| Demographics | Rating | Rank | Associate's Degree |
| Immigrants | Haiti | 0.0 /100 | #290 | Tragic 39.3% |
| Dominicans | 0.0 /100 | #291 | Tragic 39.3% |
| Blacks/African Americans | 0.0 /100 | #292 | Tragic 39.1% |
| Nepalese | 0.0 /100 | #293 | Tragic 39.0% |
| Salvadorans | 0.0 /100 | #294 | Tragic 39.0% |
| Hondurans | 0.0 /100 | #295 | Tragic 38.9% |
| Cherokee | 0.0 /100 | #296 | Tragic 38.9% |
| Cape Verdeans | 0.0 /100 | #297 | Tragic 38.8% |
| Cheyenne | 0.0 /100 | #298 | Tragic 38.7% |
| Ute | 0.0 /100 | #299 | Tragic 38.6% |
| Chickasaw | 0.0 /100 | #300 | Tragic 38.6% |
| Tsimshian | 0.0 /100 | #301 | Tragic 38.6% |
| Colville | 0.0 /100 | #302 | Tragic 38.5% |
| Guatemalans | 0.0 /100 | #303 | Tragic 38.5% |
| Sioux | 0.0 /100 | #304 | Tragic 38.5% |