Immigrants from China vs Immigrants from Peru High School Diploma
COMPARE
Immigrants from China
Immigrants from Peru
High School Diploma
High School Diploma Comparison
Immigrants from China
Immigrants from Peru
89.3%
HIGH SCHOOL DIPLOMA
62.0/ 100
METRIC RATING
159th/ 347
METRIC RANK
87.3%
HIGH SCHOOL DIPLOMA
0.4/ 100
METRIC RATING
262nd/ 347
METRIC RANK
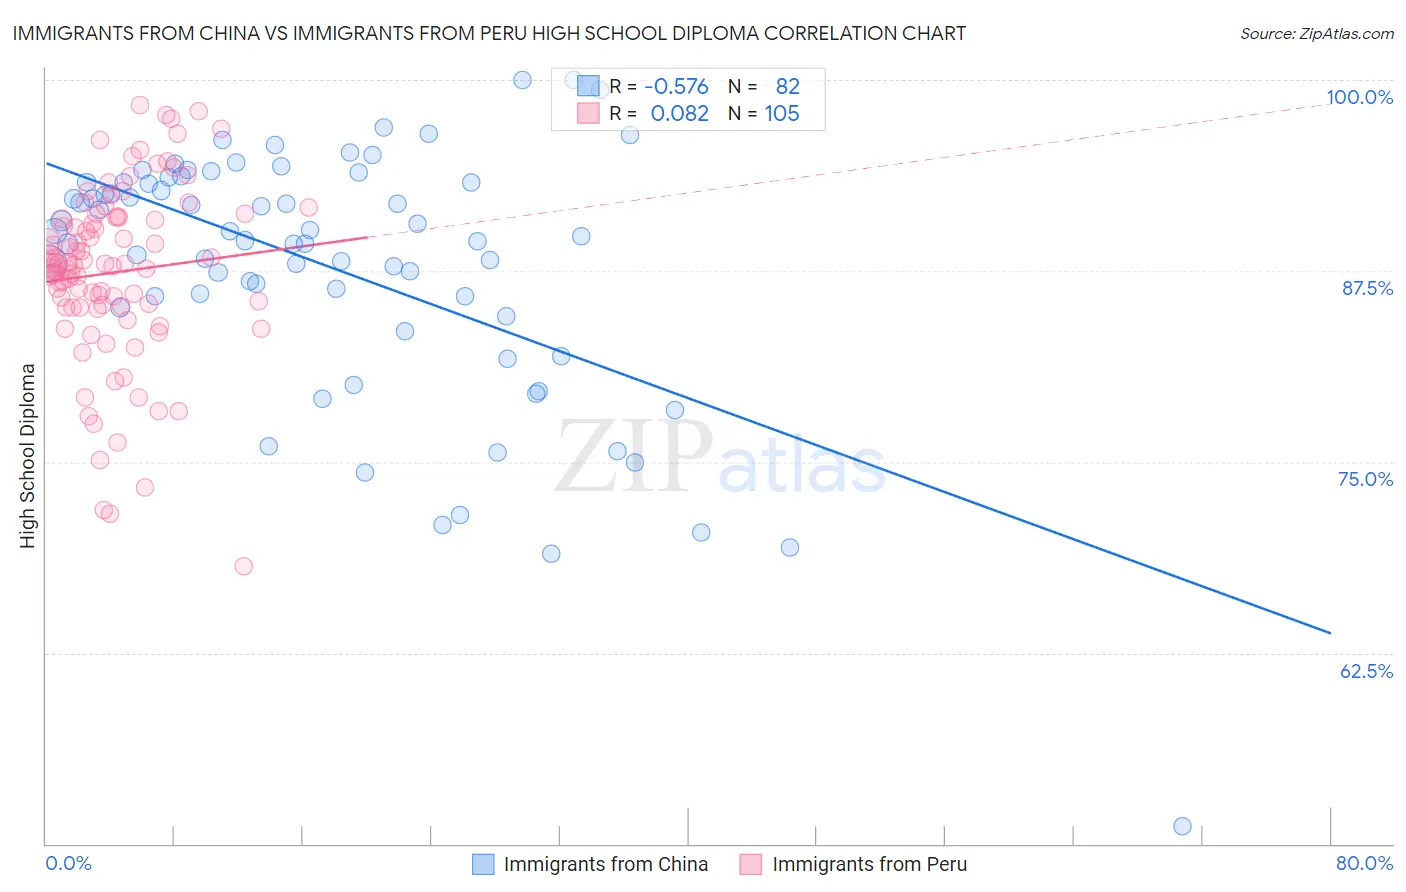
Immigrants from China vs Immigrants from Peru High School Diploma Correlation Chart
The statistical analysis conducted on geographies consisting of 457,082,738 people shows a substantial negative correlation between the proportion of Immigrants from China and percentage of population with at least high school diploma education in the United States with a correlation coefficient (R) of -0.576 and weighted average of 89.3%. Similarly, the statistical analysis conducted on geographies consisting of 328,860,567 people shows a slight positive correlation between the proportion of Immigrants from Peru and percentage of population with at least high school diploma education in the United States with a correlation coefficient (R) of 0.082 and weighted average of 87.3%, a difference of 2.4%.
High School Diploma Correlation Summary
| Measurement | Immigrants from China | Immigrants from Peru |
| Minimum | 51.2% | 68.2% |
| Maximum | 100.0% | 98.4% |
| Range | 48.8% | 30.2% |
| Mean | 87.6% | 87.4% |
| Median | 89.6% | 87.9% |
| Interquartile 25% (IQ1) | 85.1% | 85.1% |
| Interquartile 75% (IQ3) | 93.3% | 91.0% |
| Interquartile Range (IQR) | 8.2% | 5.9% |
| Standard Deviation (Sample) | 8.5% | 5.8% |
| Standard Deviation (Population) | 8.4% | 5.8% |
Similar Demographics by High School Diploma
Demographics Similar to Immigrants from China by High School Diploma
In terms of high school diploma, the demographic groups most similar to Immigrants from China are Laotian (89.3%, a difference of 0.0%), Immigrants from Pakistan (89.3%, a difference of 0.010%), Brazilian (89.3%, a difference of 0.010%), Bermudan (89.3%, a difference of 0.010%), and Cree (89.3%, a difference of 0.010%).
| Demographics | Rating | Rank | High School Diploma |
| Asians | 70.7 /100 | #152 | Good 89.4% |
| Immigrants | Iraq | 68.7 /100 | #153 | Good 89.4% |
| Alsatians | 66.8 /100 | #154 | Good 89.4% |
| Immigrants | Northern Africa | 66.4 /100 | #155 | Good 89.4% |
| Immigrants | Argentina | 65.5 /100 | #156 | Good 89.4% |
| Immigrants | Malaysia | 63.5 /100 | #157 | Good 89.3% |
| Immigrants | Pakistan | 62.5 /100 | #158 | Good 89.3% |
| Immigrants | China | 62.0 /100 | #159 | Good 89.3% |
| Laotians | 61.8 /100 | #160 | Good 89.3% |
| Brazilians | 61.2 /100 | #161 | Good 89.3% |
| Bermudans | 61.1 /100 | #162 | Good 89.3% |
| Cree | 61.1 /100 | #163 | Good 89.3% |
| Immigrants | Nepal | 61.1 /100 | #164 | Good 89.3% |
| Immigrants | Asia | 59.8 /100 | #165 | Average 89.3% |
| Immigrants | Albania | 59.4 /100 | #166 | Average 89.3% |
Demographics Similar to Immigrants from Peru by High School Diploma
In terms of high school diploma, the demographic groups most similar to Immigrants from Peru are Seminole (87.3%, a difference of 0.030%), Immigrants from South Eastern Asia (87.2%, a difference of 0.030%), Cajun (87.3%, a difference of 0.050%), Jamaican (87.2%, a difference of 0.050%), and Immigrants from Western Africa (87.4%, a difference of 0.13%).
| Demographics | Rating | Rank | High School Diploma |
| Immigrants | Senegal | 0.9 /100 | #255 | Tragic 87.6% |
| Africans | 0.7 /100 | #256 | Tragic 87.5% |
| Bahamians | 0.7 /100 | #257 | Tragic 87.5% |
| Immigrants | Ghana | 0.5 /100 | #258 | Tragic 87.4% |
| Immigrants | Western Africa | 0.5 /100 | #259 | Tragic 87.4% |
| Cajuns | 0.4 /100 | #260 | Tragic 87.3% |
| Seminole | 0.4 /100 | #261 | Tragic 87.3% |
| Immigrants | Peru | 0.4 /100 | #262 | Tragic 87.3% |
| Immigrants | South Eastern Asia | 0.3 /100 | #263 | Tragic 87.2% |
| Jamaicans | 0.3 /100 | #264 | Tragic 87.2% |
| U.S. Virgin Islanders | 0.2 /100 | #265 | Tragic 87.1% |
| Immigrants | Congo | 0.2 /100 | #266 | Tragic 87.0% |
| Blacks/African Americans | 0.2 /100 | #267 | Tragic 87.0% |
| Pennsylvania Germans | 0.2 /100 | #268 | Tragic 87.0% |
| Sri Lankans | 0.2 /100 | #269 | Tragic 87.0% |