Immigrants from Central America vs White/Caucasian 3rd Grade
COMPARE
Immigrants from Central America
White/Caucasian
3rd Grade
3rd Grade Comparison
Immigrants from Central America
Whites/Caucasians
95.8%
3RD GRADE
0.0/ 100
METRIC RATING
341st/ 347
METRIC RANK
98.3%
3RD GRADE
99.8/ 100
METRIC RATING
52nd/ 347
METRIC RANK
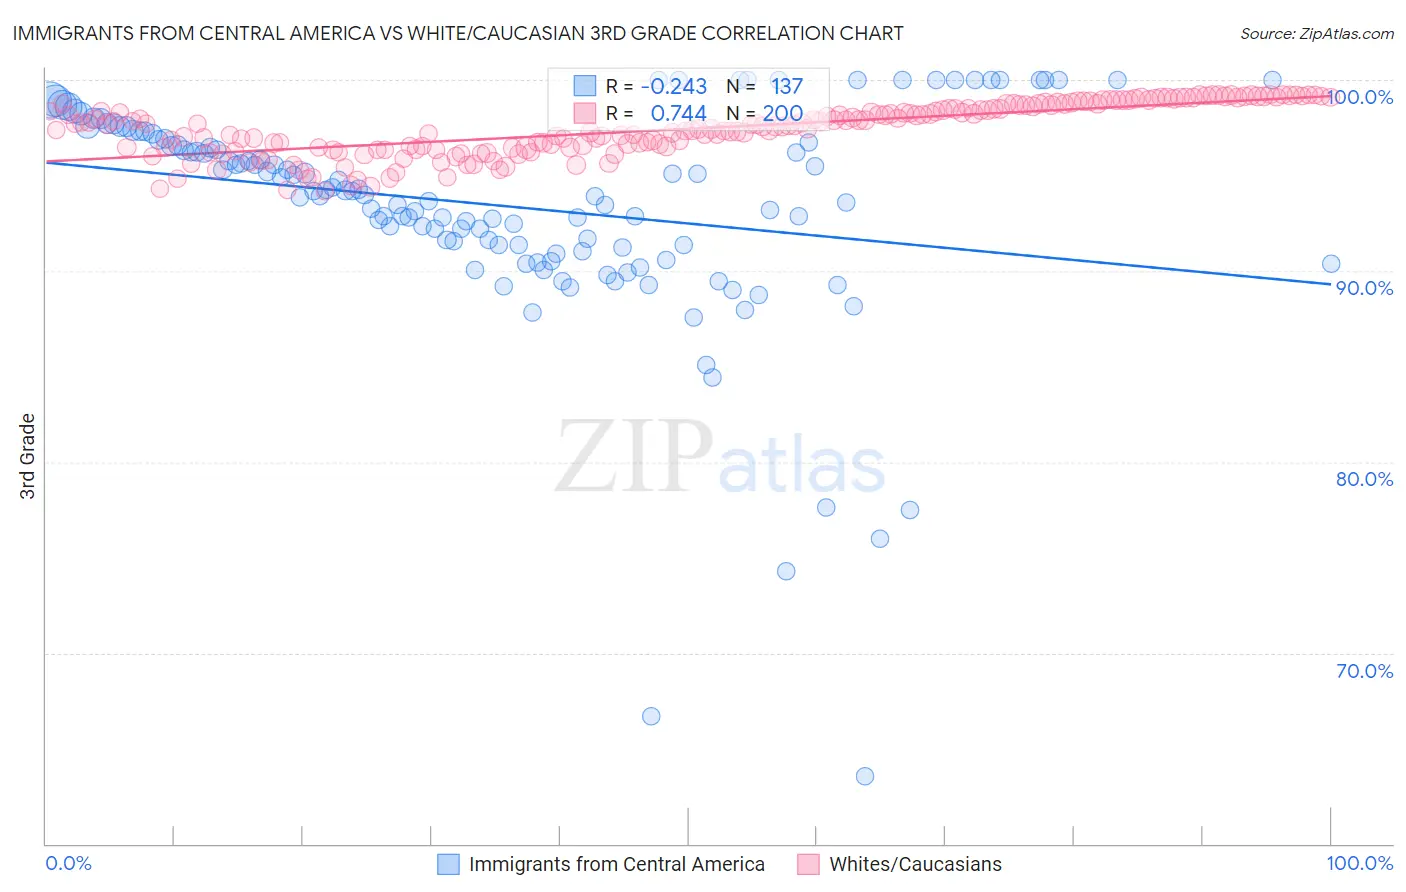
Immigrants from Central America vs White/Caucasian 3rd Grade Correlation Chart
The statistical analysis conducted on geographies consisting of 536,554,494 people shows a weak negative correlation between the proportion of Immigrants from Central America and percentage of population with at least 3rd grade education in the United States with a correlation coefficient (R) of -0.243 and weighted average of 95.8%. Similarly, the statistical analysis conducted on geographies consisting of 585,247,393 people shows a strong positive correlation between the proportion of Whites/Caucasians and percentage of population with at least 3rd grade education in the United States with a correlation coefficient (R) of 0.744 and weighted average of 98.3%, a difference of 2.6%.
3rd Grade Correlation Summary
| Measurement | Immigrants from Central America | White/Caucasian |
| Minimum | 63.5% | 94.2% |
| Maximum | 100.0% | 99.2% |
| Range | 36.5% | 5.1% |
| Mean | 93.4% | 97.4% |
| Median | 94.2% | 97.6% |
| Interquartile 25% (IQ1) | 91.3% | 96.4% |
| Interquartile 75% (IQ3) | 97.1% | 98.7% |
| Interquartile Range (IQR) | 5.8% | 2.2% |
| Standard Deviation (Sample) | 5.8% | 1.3% |
| Standard Deviation (Population) | 5.8% | 1.3% |
Similar Demographics by 3rd Grade
Demographics Similar to Immigrants from Central America by 3rd Grade
In terms of 3rd grade, the demographic groups most similar to Immigrants from Central America are Immigrants from Guatemala (95.8%, a difference of 0.0%), Immigrants from Mexico (95.8%, a difference of 0.040%), Nepalese (95.9%, a difference of 0.060%), Yakama (95.9%, a difference of 0.13%), and Salvadoran (95.7%, a difference of 0.14%).
| Demographics | Rating | Rank | 3rd Grade |
| Immigrants | Fiji | 0.0 /100 | #333 | Tragic 96.2% |
| Immigrants | Cambodia | 0.0 /100 | #334 | Tragic 96.2% |
| Immigrants | Dominican Republic | 0.0 /100 | #335 | Tragic 96.2% |
| Immigrants | Cabo Verde | 0.0 /100 | #336 | Tragic 96.2% |
| Central Americans | 0.0 /100 | #337 | Tragic 96.1% |
| Guatemalans | 0.0 /100 | #338 | Tragic 96.0% |
| Yakama | 0.0 /100 | #339 | Tragic 95.9% |
| Nepalese | 0.0 /100 | #340 | Tragic 95.9% |
| Immigrants | Central America | 0.0 /100 | #341 | Tragic 95.8% |
| Immigrants | Guatemala | 0.0 /100 | #342 | Tragic 95.8% |
| Immigrants | Mexico | 0.0 /100 | #343 | Tragic 95.8% |
| Salvadorans | 0.0 /100 | #344 | Tragic 95.7% |
| Immigrants | Yemen | 0.0 /100 | #345 | Tragic 95.6% |
| Immigrants | El Salvador | 0.0 /100 | #346 | Tragic 95.5% |
| Spanish American Indians | 0.0 /100 | #347 | Tragic 95.3% |
Demographics Similar to Whites/Caucasians by 3rd Grade
In terms of 3rd grade, the demographic groups most similar to Whites/Caucasians are Estonian (98.3%, a difference of 0.0%), Celtic (98.3%, a difference of 0.0%), Australian (98.3%, a difference of 0.0%), Immigrants from Scotland (98.3%, a difference of 0.010%), and Bulgarian (98.3%, a difference of 0.010%).
| Demographics | Rating | Rank | 3rd Grade |
| Native Hawaiians | 99.9 /100 | #45 | Exceptional 98.3% |
| Ottawa | 99.8 /100 | #46 | Exceptional 98.3% |
| Czechoslovakians | 99.8 /100 | #47 | Exceptional 98.3% |
| Lumbee | 99.8 /100 | #48 | Exceptional 98.3% |
| Estonians | 99.8 /100 | #49 | Exceptional 98.3% |
| Celtics | 99.8 /100 | #50 | Exceptional 98.3% |
| Australians | 99.8 /100 | #51 | Exceptional 98.3% |
| Whites/Caucasians | 99.8 /100 | #52 | Exceptional 98.3% |
| Immigrants | Scotland | 99.8 /100 | #53 | Exceptional 98.3% |
| Bulgarians | 99.8 /100 | #54 | Exceptional 98.3% |
| Americans | 99.8 /100 | #55 | Exceptional 98.3% |
| Austrians | 99.8 /100 | #56 | Exceptional 98.3% |
| Slavs | 99.7 /100 | #57 | Exceptional 98.3% |
| Greeks | 99.7 /100 | #58 | Exceptional 98.3% |
| Maltese | 99.7 /100 | #59 | Exceptional 98.3% |