Immigrants from Caribbean vs Immigrants from Dominica 4th Grade
COMPARE
Immigrants from Caribbean
Immigrants from Dominica
4th Grade
4th Grade Comparison
Immigrants from Caribbean
Immigrants from Dominica
96.4%
4TH GRADE
0.0/ 100
METRIC RATING
305th/ 347
METRIC RANK
96.5%
4TH GRADE
0.0/ 100
METRIC RATING
299th/ 347
METRIC RANK
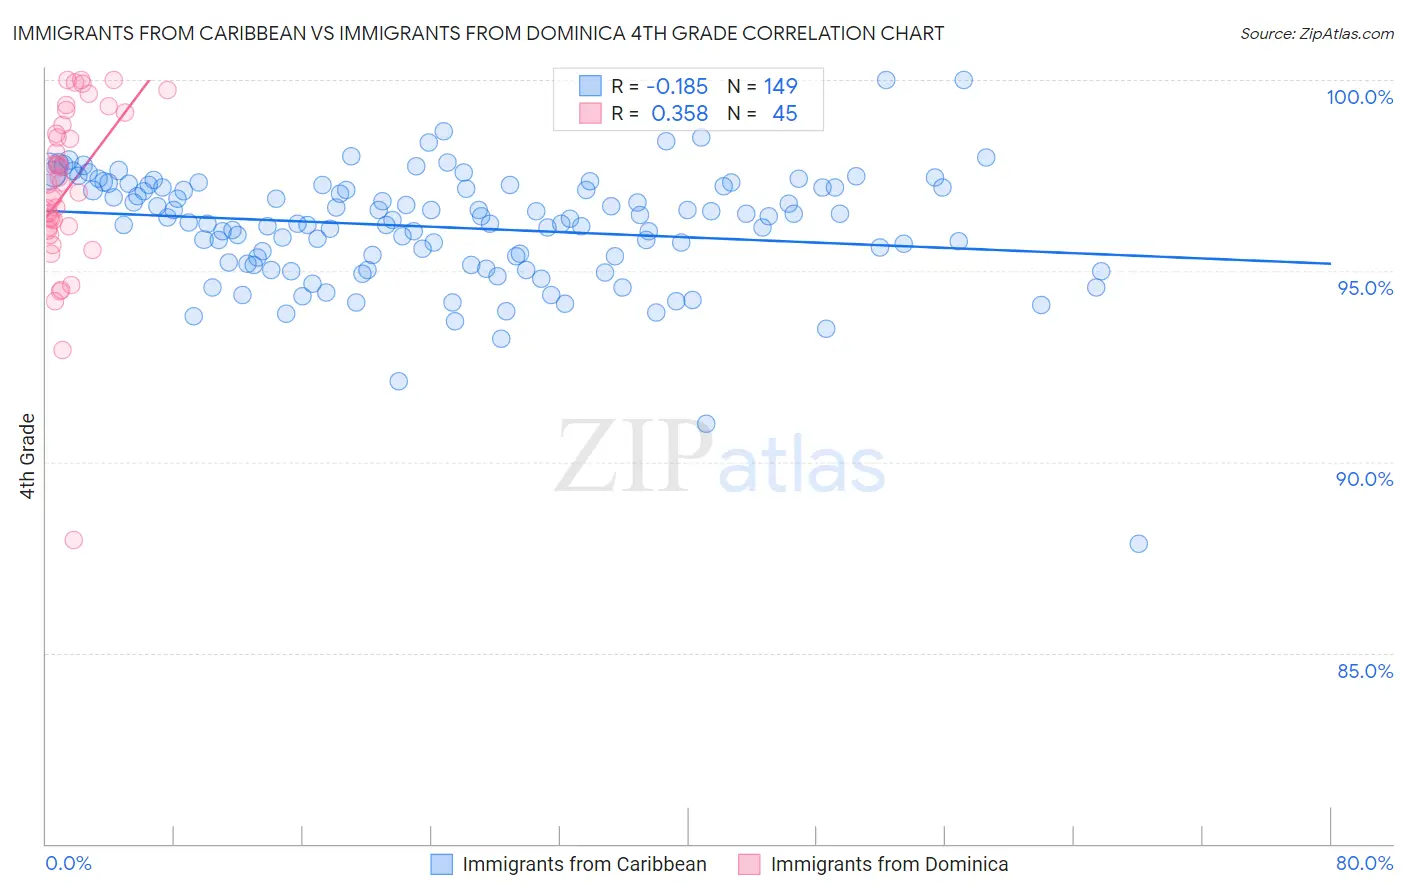
Immigrants from Caribbean vs Immigrants from Dominica 4th Grade Correlation Chart
The statistical analysis conducted on geographies consisting of 450,065,262 people shows a poor negative correlation between the proportion of Immigrants from Caribbean and percentage of population with at least 4th grade education in the United States with a correlation coefficient (R) of -0.185 and weighted average of 96.4%. Similarly, the statistical analysis conducted on geographies consisting of 83,794,115 people shows a mild positive correlation between the proportion of Immigrants from Dominica and percentage of population with at least 4th grade education in the United States with a correlation coefficient (R) of 0.358 and weighted average of 96.5%, a difference of 0.16%.
4th Grade Correlation Summary
| Measurement | Immigrants from Caribbean | Immigrants from Dominica |
| Minimum | 87.9% | 88.0% |
| Maximum | 100.0% | 100.0% |
| Range | 12.1% | 12.0% |
| Mean | 96.1% | 97.1% |
| Median | 96.3% | 97.3% |
| Interquartile 25% (IQ1) | 95.2% | 96.1% |
| Interquartile 75% (IQ3) | 97.2% | 99.0% |
| Interquartile Range (IQR) | 2.0% | 2.9% |
| Standard Deviation (Sample) | 1.5% | 2.3% |
| Standard Deviation (Population) | 1.5% | 2.3% |
Demographics Similar to Immigrants from Caribbean and Immigrants from Dominica by 4th Grade
In terms of 4th grade, the demographic groups most similar to Immigrants from Caribbean are Sri Lankan (96.4%, a difference of 0.010%), Ecuadorian (96.4%, a difference of 0.020%), Guyanese (96.4%, a difference of 0.030%), Immigrants from Haiti (96.3%, a difference of 0.040%), and Immigrants from Laos (96.3%, a difference of 0.050%). Similarly, the demographic groups most similar to Immigrants from Dominica are Haitian (96.5%, a difference of 0.010%), Immigrants from South Eastern Asia (96.5%, a difference of 0.010%), Immigrants from Somalia (96.5%, a difference of 0.030%), Immigrants (96.5%, a difference of 0.050%), and Immigrants from Cuba (96.4%, a difference of 0.090%).
| Demographics | Rating | Rank | 4th Grade |
| Malaysians | 0.0 /100 | #292 | Tragic 96.7% |
| Puerto Ricans | 0.0 /100 | #293 | Tragic 96.7% |
| Immigrants | Eritrea | 0.0 /100 | #294 | Tragic 96.7% |
| Immigrants | Portugal | 0.0 /100 | #295 | Tragic 96.6% |
| Somalis | 0.0 /100 | #296 | Tragic 96.6% |
| Immigrants | Somalia | 0.0 /100 | #297 | Tragic 96.5% |
| Haitians | 0.0 /100 | #298 | Tragic 96.5% |
| Immigrants | Dominica | 0.0 /100 | #299 | Tragic 96.5% |
| Immigrants | South Eastern Asia | 0.0 /100 | #300 | Tragic 96.5% |
| Immigrants | Immigrants | 0.0 /100 | #301 | Tragic 96.5% |
| Immigrants | Cuba | 0.0 /100 | #302 | Tragic 96.4% |
| Guyanese | 0.0 /100 | #303 | Tragic 96.4% |
| Ecuadorians | 0.0 /100 | #304 | Tragic 96.4% |
| Immigrants | Caribbean | 0.0 /100 | #305 | Tragic 96.4% |
| Sri Lankans | 0.0 /100 | #306 | Tragic 96.4% |
| Immigrants | Haiti | 0.0 /100 | #307 | Tragic 96.3% |
| Immigrants | Laos | 0.0 /100 | #308 | Tragic 96.3% |
| Immigrants | Guyana | 0.0 /100 | #309 | Tragic 96.3% |
| Immigrants | Burma/Myanmar | 0.0 /100 | #310 | Tragic 96.3% |
| Immigrants | Bangladesh | 0.0 /100 | #311 | Tragic 96.2% |
| Cape Verdeans | 0.0 /100 | #312 | Tragic 96.2% |