Immigrants from Canada vs Spanish College, Under 1 year
COMPARE
Immigrants from Canada
Spanish
College, Under 1 year
College, Under 1 year Comparison
Immigrants from Canada
Spanish
69.1%
COLLEGE, UNDER 1 YEAR
99.4/ 100
METRIC RATING
63rd/ 347
METRIC RANK
64.9%
COLLEGE, UNDER 1 YEAR
31.6/ 100
METRIC RATING
189th/ 347
METRIC RANK
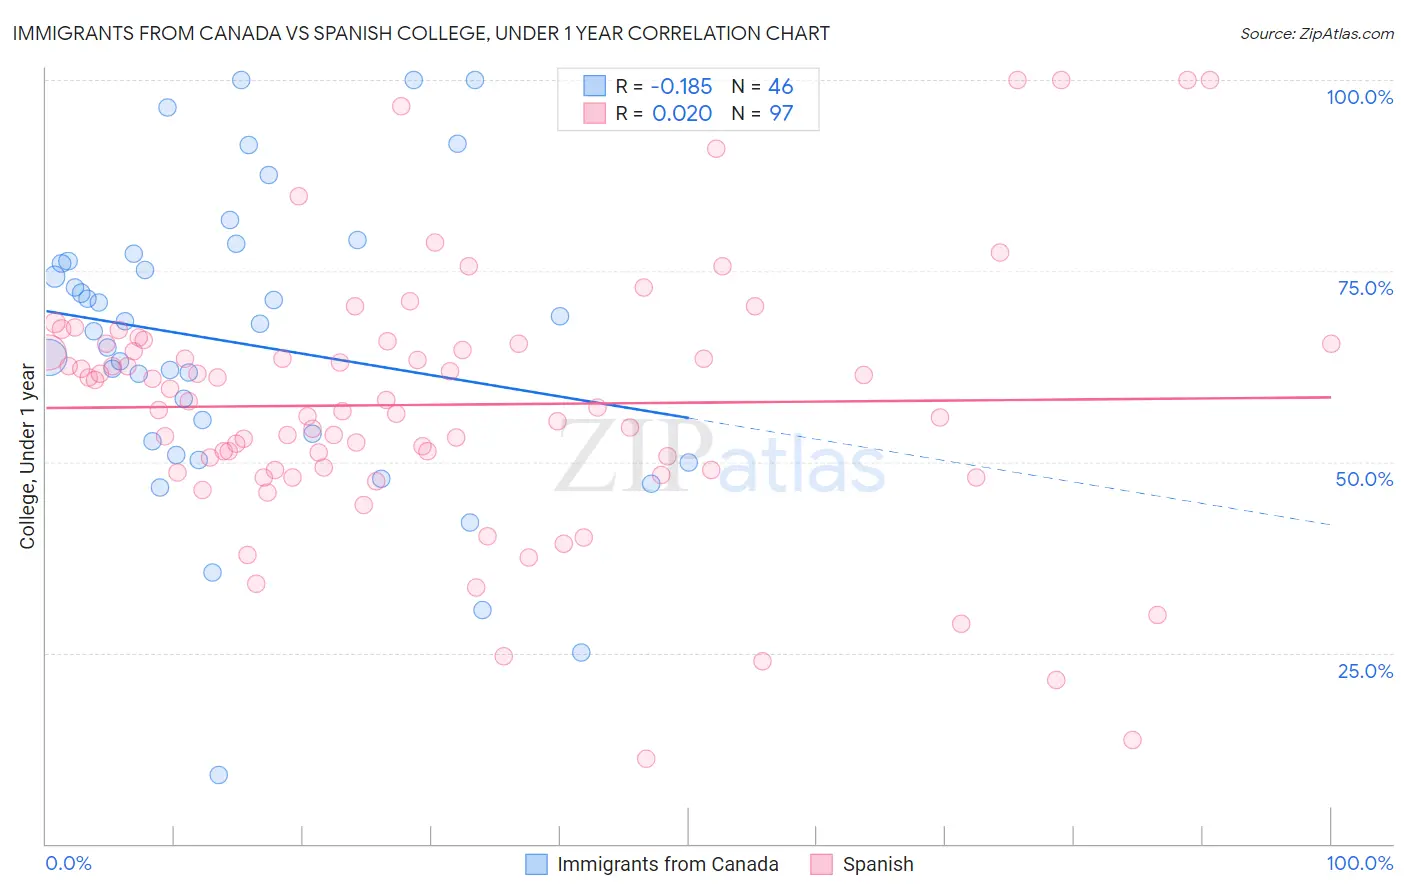
Immigrants from Canada vs Spanish College, Under 1 year Correlation Chart
The statistical analysis conducted on geographies consisting of 459,392,552 people shows a poor negative correlation between the proportion of Immigrants from Canada and percentage of population with at least college, under 1 year education in the United States with a correlation coefficient (R) of -0.185 and weighted average of 69.1%. Similarly, the statistical analysis conducted on geographies consisting of 422,188,866 people shows no correlation between the proportion of Spanish and percentage of population with at least college, under 1 year education in the United States with a correlation coefficient (R) of 0.020 and weighted average of 64.9%, a difference of 6.5%.
College, Under 1 year Correlation Summary
| Measurement | Immigrants from Canada | Spanish |
| Minimum | 9.0% | 11.1% |
| Maximum | 100.0% | 100.0% |
| Range | 91.0% | 88.9% |
| Mean | 65.5% | 57.5% |
| Median | 67.6% | 57.1% |
| Interquartile 25% (IQ1) | 52.7% | 48.9% |
| Interquartile 75% (IQ3) | 76.3% | 65.5% |
| Interquartile Range (IQR) | 23.5% | 16.6% |
| Standard Deviation (Sample) | 19.7% | 17.0% |
| Standard Deviation (Population) | 19.5% | 17.0% |
Similar Demographics by College, Under 1 year
Demographics Similar to Immigrants from Canada by College, Under 1 year
In terms of college, under 1 year, the demographic groups most similar to Immigrants from Canada are Northern European (69.0%, a difference of 0.040%), Immigrants from Moldova (69.0%, a difference of 0.060%), Immigrants from North America (69.0%, a difference of 0.080%), Immigrants from Kazakhstan (69.2%, a difference of 0.13%), and Immigrants from Belarus (69.2%, a difference of 0.13%).
| Demographics | Rating | Rank | College, Under 1 year |
| Immigrants | Scotland | 99.6 /100 | #56 | Exceptional 69.4% |
| Asians | 99.6 /100 | #57 | Exceptional 69.4% |
| Immigrants | Malaysia | 99.6 /100 | #58 | Exceptional 69.3% |
| Immigrants | Serbia | 99.5 /100 | #59 | Exceptional 69.3% |
| Immigrants | Asia | 99.5 /100 | #60 | Exceptional 69.2% |
| Immigrants | Kazakhstan | 99.5 /100 | #61 | Exceptional 69.2% |
| Immigrants | Belarus | 99.5 /100 | #62 | Exceptional 69.2% |
| Immigrants | Canada | 99.4 /100 | #63 | Exceptional 69.1% |
| Northern Europeans | 99.4 /100 | #64 | Exceptional 69.0% |
| Immigrants | Moldova | 99.3 /100 | #65 | Exceptional 69.0% |
| Immigrants | North America | 99.3 /100 | #66 | Exceptional 69.0% |
| Immigrants | Zimbabwe | 99.2 /100 | #67 | Exceptional 68.9% |
| Immigrants | Indonesia | 99.2 /100 | #68 | Exceptional 68.9% |
| Immigrants | Romania | 99.2 /100 | #69 | Exceptional 68.9% |
| Lithuanians | 99.1 /100 | #70 | Exceptional 68.8% |
Demographics Similar to Spanish by College, Under 1 year
In terms of college, under 1 year, the demographic groups most similar to Spanish are Immigrants from Albania (64.9%, a difference of 0.020%), Immigrants from Philippines (64.8%, a difference of 0.080%), Immigrants from Southern Europe (64.9%, a difference of 0.14%), Immigrants from Armenia (64.7%, a difference of 0.19%), and Immigrants from Thailand (64.7%, a difference of 0.24%).
| Demographics | Rating | Rank | College, Under 1 year |
| Immigrants | Africa | 44.7 /100 | #182 | Average 65.3% |
| Immigrants | Poland | 42.6 /100 | #183 | Average 65.2% |
| Bermudans | 42.0 /100 | #184 | Average 65.2% |
| Sri Lankans | 41.7 /100 | #185 | Average 65.2% |
| Immigrants | Sierra Leone | 39.7 /100 | #186 | Fair 65.1% |
| Immigrants | Southern Europe | 34.3 /100 | #187 | Fair 64.9% |
| Immigrants | Albania | 32.0 /100 | #188 | Fair 64.9% |
| Spanish | 31.6 /100 | #189 | Fair 64.9% |
| Immigrants | Philippines | 30.1 /100 | #190 | Fair 64.8% |
| Immigrants | Armenia | 28.1 /100 | #191 | Fair 64.7% |
| Immigrants | Thailand | 27.0 /100 | #192 | Fair 64.7% |
| Slovaks | 26.7 /100 | #193 | Fair 64.7% |
| Immigrants | Cameroon | 24.6 /100 | #194 | Fair 64.6% |
| Immigrants | South Eastern Asia | 22.1 /100 | #195 | Fair 64.5% |
| Tongans | 21.2 /100 | #196 | Fair 64.5% |