Immigrants from Cameroon vs Polish Nursery School
COMPARE
Immigrants from Cameroon
Polish
Nursery School
Nursery School Comparison
Immigrants from Cameroon
Poles
97.5%
NURSERY SCHOOL
0.1/ 100
METRIC RATING
274th/ 347
METRIC RANK
98.6%
NURSERY SCHOOL
100.0/ 100
METRIC RATING
23rd/ 347
METRIC RANK
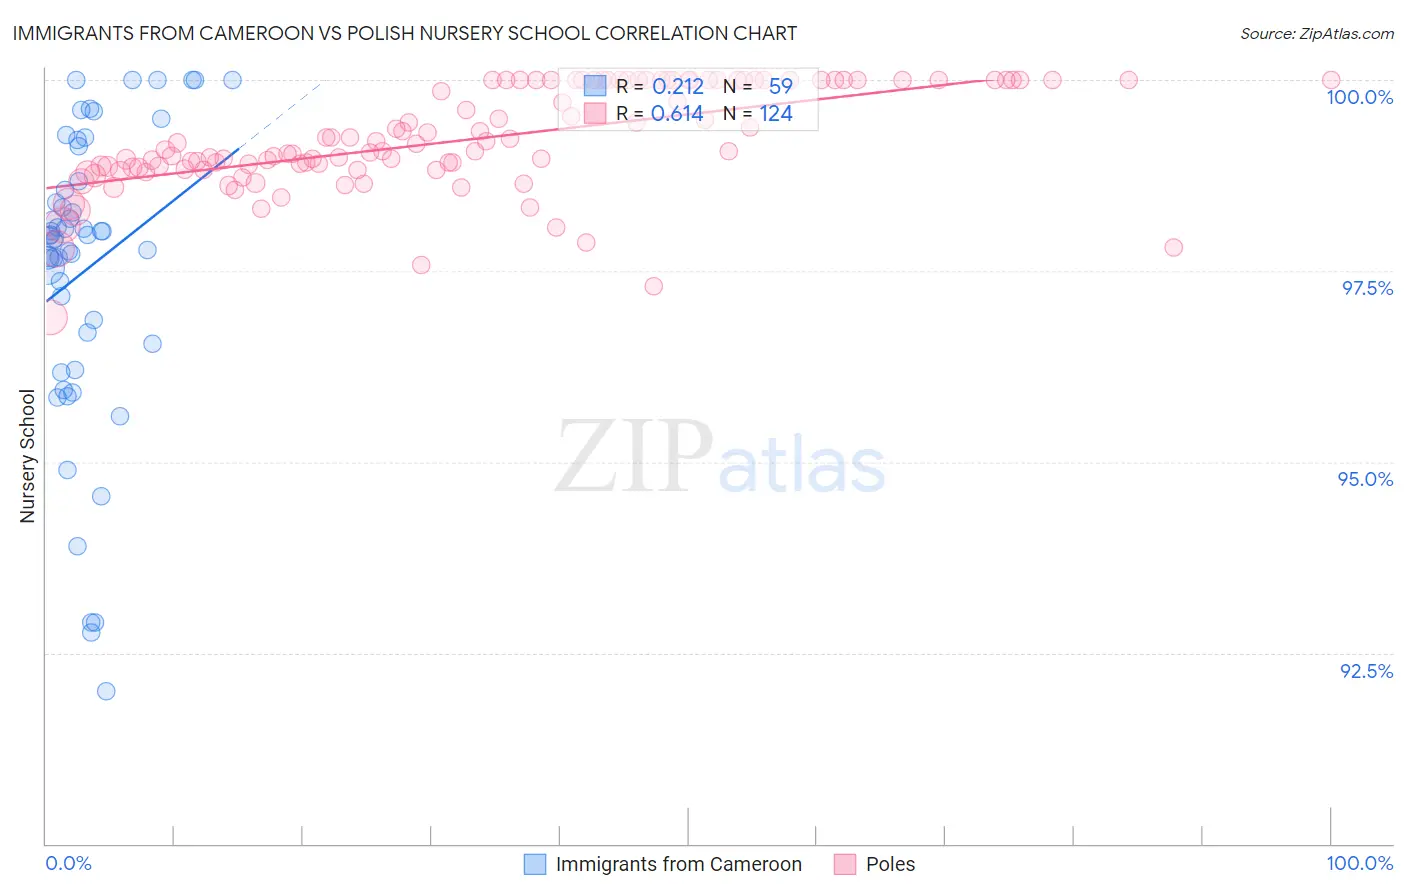
Immigrants from Cameroon vs Polish Nursery School Correlation Chart
The statistical analysis conducted on geographies consisting of 130,769,742 people shows a weak positive correlation between the proportion of Immigrants from Cameroon and percentage of population with at least nursery school education in the United States with a correlation coefficient (R) of 0.212 and weighted average of 97.5%. Similarly, the statistical analysis conducted on geographies consisting of 560,594,514 people shows a significant positive correlation between the proportion of Poles and percentage of population with at least nursery school education in the United States with a correlation coefficient (R) of 0.614 and weighted average of 98.6%, a difference of 1.2%.
Nursery School Correlation Summary
| Measurement | Immigrants from Cameroon | Polish |
| Minimum | 92.0% | 96.9% |
| Maximum | 100.0% | 100.0% |
| Range | 8.0% | 3.1% |
| Mean | 97.5% | 99.2% |
| Median | 98.0% | 99.1% |
| Interquartile 25% (IQ1) | 96.5% | 98.8% |
| Interquartile 75% (IQ3) | 98.7% | 100.0% |
| Interquartile Range (IQR) | 2.1% | 1.2% |
| Standard Deviation (Sample) | 1.9% | 0.68% |
| Standard Deviation (Population) | 1.9% | 0.67% |
Similar Demographics by Nursery School
Demographics Similar to Immigrants from Cameroon by Nursery School
In terms of nursery school, the demographic groups most similar to Immigrants from Cameroon are Immigrants from China (97.5%, a difference of 0.0%), Ghanaian (97.5%, a difference of 0.0%), Immigrants from Bolivia (97.5%, a difference of 0.020%), Immigrants from Philippines (97.5%, a difference of 0.020%), and Immigrants from Western Africa (97.4%, a difference of 0.030%).
| Demographics | Rating | Rank | Nursery School |
| Immigrants | Nigeria | 0.3 /100 | #267 | Tragic 97.5% |
| West Indians | 0.3 /100 | #268 | Tragic 97.5% |
| Immigrants | Liberia | 0.3 /100 | #269 | Tragic 97.5% |
| Immigrants | Jamaica | 0.2 /100 | #270 | Tragic 97.5% |
| Immigrants | Peru | 0.2 /100 | #271 | Tragic 97.5% |
| Immigrants | Bolivia | 0.1 /100 | #272 | Tragic 97.5% |
| Immigrants | China | 0.1 /100 | #273 | Tragic 97.5% |
| Immigrants | Cameroon | 0.1 /100 | #274 | Tragic 97.5% |
| Ghanaians | 0.1 /100 | #275 | Tragic 97.5% |
| Immigrants | Philippines | 0.1 /100 | #276 | Tragic 97.5% |
| Immigrants | Western Africa | 0.1 /100 | #277 | Tragic 97.4% |
| Immigrants | Uzbekistan | 0.1 /100 | #278 | Tragic 97.4% |
| Immigrants | Ghana | 0.1 /100 | #279 | Tragic 97.4% |
| Barbadians | 0.0 /100 | #280 | Tragic 97.4% |
| Trinidadians and Tobagonians | 0.0 /100 | #281 | Tragic 97.4% |
Demographics Similar to Poles by Nursery School
In terms of nursery school, the demographic groups most similar to Poles are Pennsylvania German (98.6%, a difference of 0.0%), Finnish (98.6%, a difference of 0.0%), Lithuanian (98.6%, a difference of 0.0%), Danish (98.6%, a difference of 0.0%), and Scotch-Irish (98.6%, a difference of 0.0%).
| Demographics | Rating | Rank | Nursery School |
| Scottish | 100.0 /100 | #16 | Exceptional 98.7% |
| Aleuts | 100.0 /100 | #17 | Exceptional 98.7% |
| Dutch | 100.0 /100 | #18 | Exceptional 98.7% |
| Irish | 100.0 /100 | #19 | Exceptional 98.6% |
| Pennsylvania Germans | 100.0 /100 | #20 | Exceptional 98.6% |
| Finns | 100.0 /100 | #21 | Exceptional 98.6% |
| Lithuanians | 100.0 /100 | #22 | Exceptional 98.6% |
| Poles | 100.0 /100 | #23 | Exceptional 98.6% |
| Danes | 100.0 /100 | #24 | Exceptional 98.6% |
| Scotch-Irish | 100.0 /100 | #25 | Exceptional 98.6% |
| Sioux | 100.0 /100 | #26 | Exceptional 98.6% |
| Arapaho | 100.0 /100 | #27 | Exceptional 98.6% |
| Croatians | 100.0 /100 | #28 | Exceptional 98.6% |
| French | 100.0 /100 | #29 | Exceptional 98.6% |
| Europeans | 100.0 /100 | #30 | Exceptional 98.6% |